01
L1 · Macro
What could invalidate the risk posture?
Rates, liquidity, policy, growth, dollar, and cross-asset risk define the backdrop.
Read L1CryptoWatch scores evidence across four layers and produces one clear read for each of five decisions — with confidence, invalidation, and public accountability attached.
The five public decisions lead. Four evidence layers explain what can support, weaken, or invalidate each read.
What could invalidate the risk posture?
Rates, liquidity, policy, growth, dollar, and cross-asset risk define the backdrop.
Read L1Where are we in the cycle?
Structural phase, valuation, momentum, and historical analogs define cycle position.
Read L2What is participant behavior saying?
Network activity, holder behavior, flows, and cohort structure confirm or contradict the thesis.
Read L3How is risk positioned now?
Derivatives, volatility, sentiment, and crowding shape timing and asymmetric risk.
Read L4One Bitcoin state, five decision views. Start with the verdict; open only evidence that can change it.
| Destination | Question it answers | Route |
|---|---|---|
| Bitcoin State | What is Bitcoin's complete state right now? | /state |
| Today's Read | What are the five decisions now? | /macro |
| Action | What posture and invalidation govern the next decision? | /macro |
| Track Record + Ledger | How has the system performed, and can I verify the record? | /track-record/ledger |
| AI Agents | How can software use the same synthesis? | /agents |
| Site Map | Where does every active page live? | /sitemap |
State → decision → evidence → action → accountability. Bitcoin State holds the complete thesis. Now, Cycle, Money, Macro, and Action keep each decision concise. Track Record and Ledger preserve the receipts.
This is the user field guide for the current Macro surface: 10 visible owners (five primary, four supporting, one Proof). Open a card for the metric definition, the interpretation rule, the decision it feeds, and the condition that makes the read unsafe. Folded former panels remain as closed receipts on those owners — they are not second conclusions. Receipts under one owner are siblings: one click each, never a closed receipt inside another closed receipt.
| Screen | Visible owners | Closed receipts (siblings, not extra owners) |
|---|---|---|
| Now | Composite (primary). Since Yesterday and Decision Integrity start behind Supporting signals. | Composite evidence trail |
| Cycle | Cycle Position (primary, hero + phase bar). CW Risk starts behind Supporting signals. | Bottoming, historical validation, Cointime, Halving, value zone, LTH cohort, Cowen, Hot Capital, Three-Layer |
| Money | Liquidity (primary). Entity Regime starts behind Supporting signals. | Treasuries, ETF / pipeline / money-flow, 24h · 30d · context, LTH→exchange, supply dynamics |
| Macro | Macro Permission (primary) | Compass / regime radar, tail-risk, capital rotation, liquidity/rates/risk/rotation groups |
| Action | BTC Setup (primary) | Timing rows, DCA map, where valuation waits, institutional sizing, price chart |
| Proof | Track Record | Today's 5–7 day call, resolved-call grid |
A synthesis is not a new raw metric. It combines several owned inputs under declared rules. Always read it in this order: verdict → score or state → coverage → agreement → freshness → invalidation. A strong-looking verdict with weak coverage or stale evidence is a weak read.
CryptoWatch compresses eight evidence families into the existing five decisions: entity accumulation, supply liquidity, network demand, holder spending, old-coin activity, miner health, buyer/seller alignment, and ownership-cost position. Confidence is decomposed into coverage, agreement, persistence, historical reliability, and regime relevance. Historical reliability stays unavailable until enough daily receipts exist; the ownership-cost read uses verified cost-basis levels and does not claim to be a full URPD histogram.
Snapshots explain layout and labels; they are not live recommendations. Values can be loading, unavailable, or different from today. Open Today’s Read for the current state.
Retired as a visible panel. Threshold crossings still exist as snapshot cards and now belong to Since Yesterday.
Use Since Yesterday for material changes. Do not treat the retired alert surface as a second decision owner.
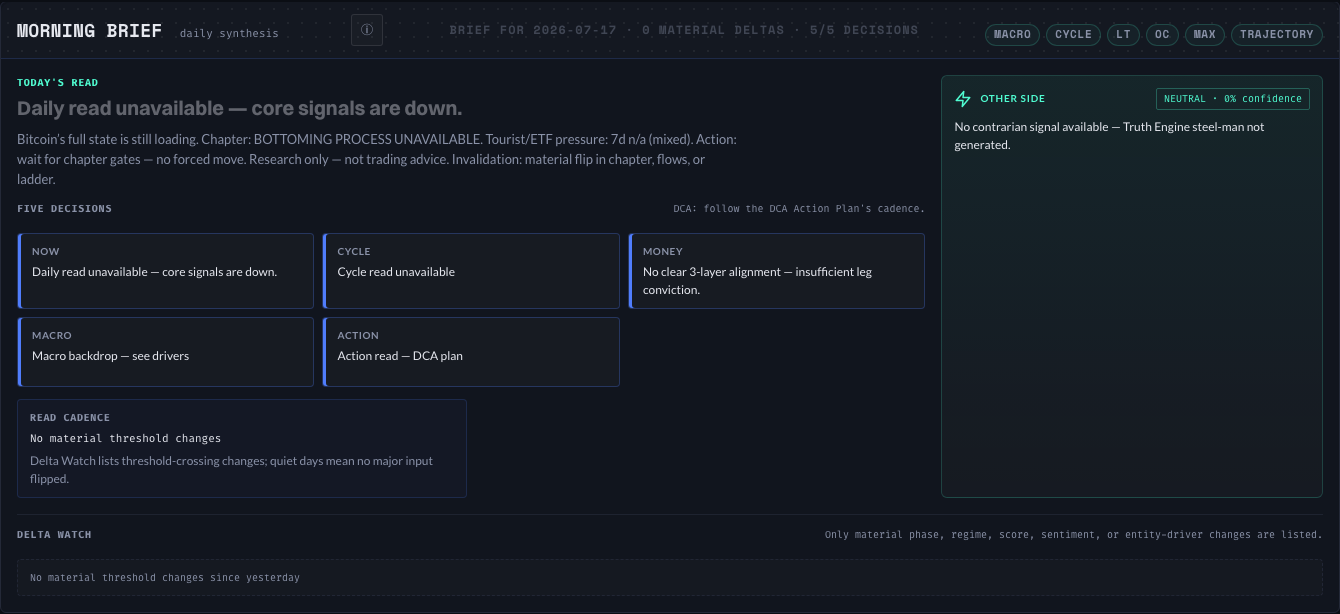
The daily synthesis, its five decisions, material changes, opposing case, invalidation, and ranked day-over-day metric moves. Each move is a z-score against that metric’s own ~30-day delta history.
Open Supporting signals on Now after the Composite. Positive z means the level rose; negative z means it fell. |z| under 1 is normal noise; |z| ≥ 2 is unusual and matters only when a related receipt agrees. A quiet Delta Watch means no threshold crossed, not that refresh failed.
A decision or material driver differs from yesterday, or an unusual move persists with corroboration.
Fewer than three metrics are available, the feed is older than 26 hours, the brief or underlying snapshot is not current, or provenance is missing.
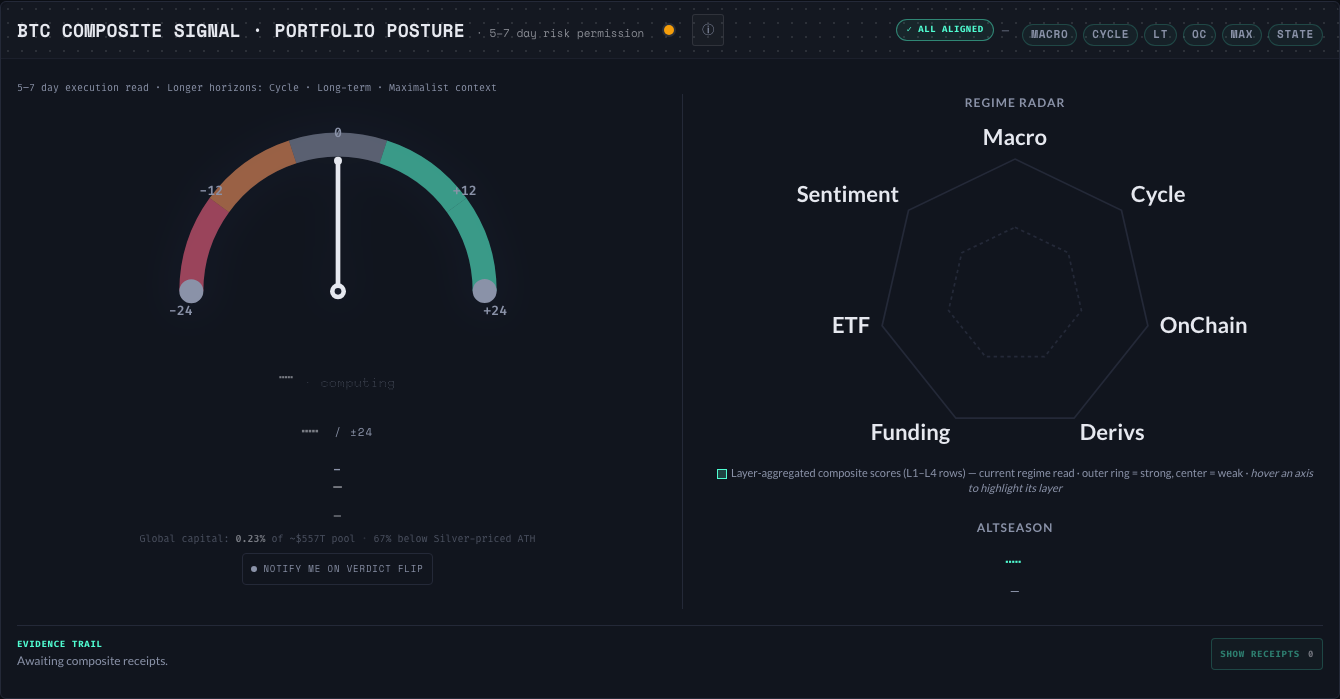
The Main Composite dial shows the signed −24 to +24 decision permission, while the attached Bitcoin Thermometer shows canonical 0–100 market heat in the same visible Now instrument. Horizon, ALIGNED chip, capital context, and gauge-probability sit in the closed evidence receipt.
Read the Main Composite first for posture, then the Bitcoin Thermometer for heat. The Thermometer is context, not a second verdict. Open the evidence receipt only when you need the trail.
The Composite crosses a verdict band; a heat move changes temperature context without independently changing the verdict.
Composite status, cycle-daily freshness, coverage, agreement, or either numeric domain fails its receipt.
Six regime lenses: four forward (macro, capital flows, investor behaviour, on-chain fundamentals) plus cycle position and derivatives context. Not a standalone Macro panel — a closed receipt on Macro Permission.
Open Macro Permission, then the compass / regime radar receipt. Use the shape to see alignment and divergence. A broad outer shape means stronger conditions; a collapsed or lopsided shape means weak or conflicted conditions.
The balance of lenses shifts the market between risk-off, transition, and risk-on states.
Too few lenses are live or one stale lens dominates the map.
Source coverage, agreement, conflicts, freshness, thesis pillars, and invalidations across the evidence used by the main read.
The current Truth/data-quality/conflict receipt plus the current Bitcoin State thesis-pillar/invalidation artifact are the provenance boundary. High coverage plus agreement permits more trust; conflicts, weak pillars, or invalidations lower confidence.
Evidence quality or a thesis pillar changes the permission to trust the Composite verdict.
You treat it as a separate buy/sell signal. It is a confidence brake: fail closed when either source receipt, provenance, or as-of is missing or stale; unavailable evidence stays unavailable.

A normalized 0–1 cycle-temperature score. Values near 0 represent capitulation-like valuation; values near 1 represent euphoria-like valuation.
Cold favors patient accumulation context; hot raises distribution risk. Mid-range values are not actionable without trend and cycle phase.
The score enters a new risk band and its companion signals agree.
Used as an exact top/bottom timer by itself.
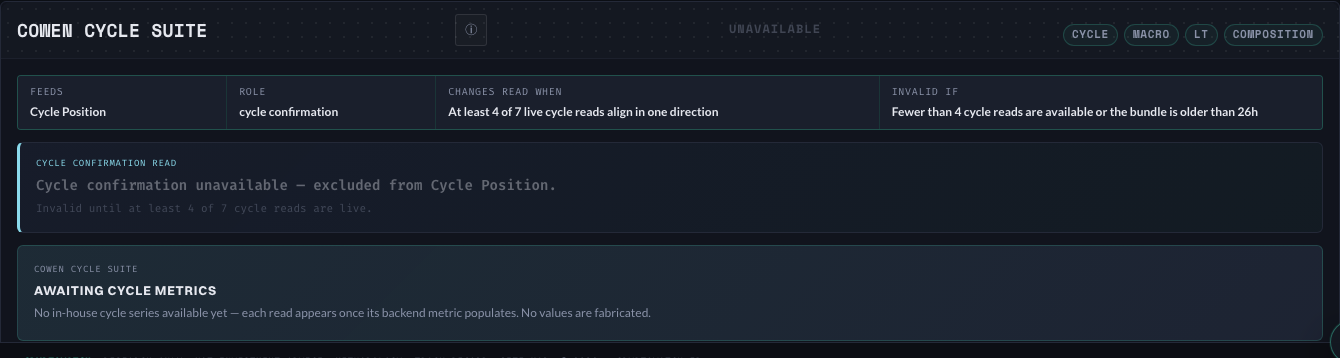
Seven complementary cycle reads covering time, long-run trend distance, realized valuation, miner economics, correction shape, cycle-relative return, and DCA seasonality.
Count directional agreement, then inspect dissenters. Four or more aligned reads create context; one clock never defines the cycle.
At least four live reads align in one direction.
Fewer than four reads are available or the bundle is older than 26 hours. The power-law read is descriptive and uncalibrated; it is not intrinsic fair value or a price target.
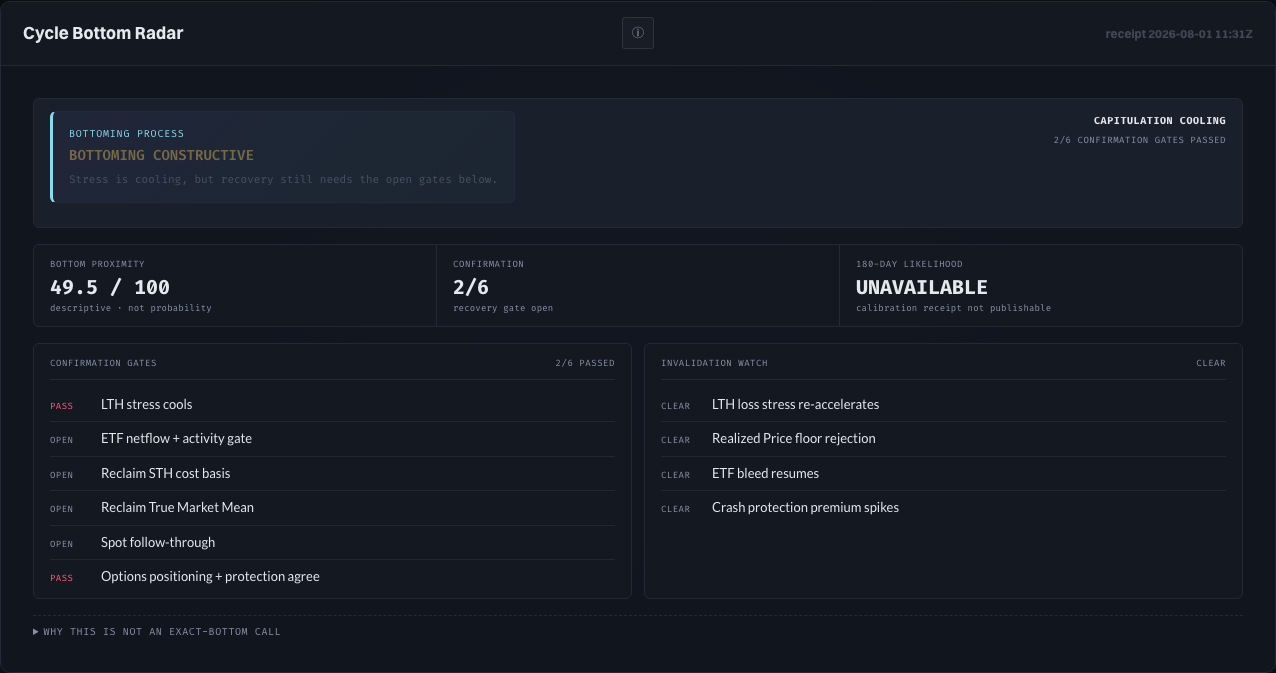
The canonical bottoming process: current state, descriptive bottom proximity, six confirmation gates, four invalidations, and the 180-day likelihood publication receipt.
Open the Bottoming process receipt on Cycle Position. Read state first, then the X/6 confirmation score. Each gate is independently PASS (true now) or OPEN (still waiting). Proximity is historical similarity — not a probability or an exact-bottom forecast. Historical validation is a sibling receipt on Cycle Position, not a second fold inside Bottoming.
Confirmation gates pass, recovery becomes eligible by rule (typically reclaim of True Market Mean with at least three gates passed and no active invalidation), or an invalidation fires.
The canonical receipt is unavailable, an invalidation is ACTIVE, or you treat 6/6 as a guaranteed low. Likelihood % stays dark until its own calibration receipt publishes.
PASS means that recovery check is currently true. OPEN means it is still waiting. A score like 2/6 means two conditions are true and four remain open — a progress bar for recovery evidence, not a win-rate or buy signal.
| Gate | What must be true |
|---|---|
| LTH stress cools | Long-term holder capitulation / loss thermometer is cooling or accumulating, not re-accelerating stress. |
| ETF dual-gate | ETF netflow stabilizes and activity is not muted relative to peak participation. |
| Reclaim STH cost basis | Spot is back above short-term holder average cost. |
| Reclaim True Market Mean | Spot is back above the active-investor “fair value” line. |
| Spot follow-through | The bounce looks like real spot demand, not only a derivatives unwind. |
| Options dual-read | Options positioning versus crash protection is not conflicted. |
No. You do not need all six for the process to matter. Stronger recovery confirmation is roughly: right state (reclaim of True Market Mean) plus at least three gates passed and zero active invalidations. 6/6 is the strongest confluence stack — still not a guaranteed cycle low or a published likelihood percentage.
Invalidations use ACTIVE / CLEAR. They answer whether the bottoming story is currently being broken (LTH stress re-accelerates, rejection toward Realized Price, ETF bleed resumes, crash-premium spike). An active invalidation weakens the process even if some confirmation gates pass.
Full methodology: Bottoming process (Cycle Position).
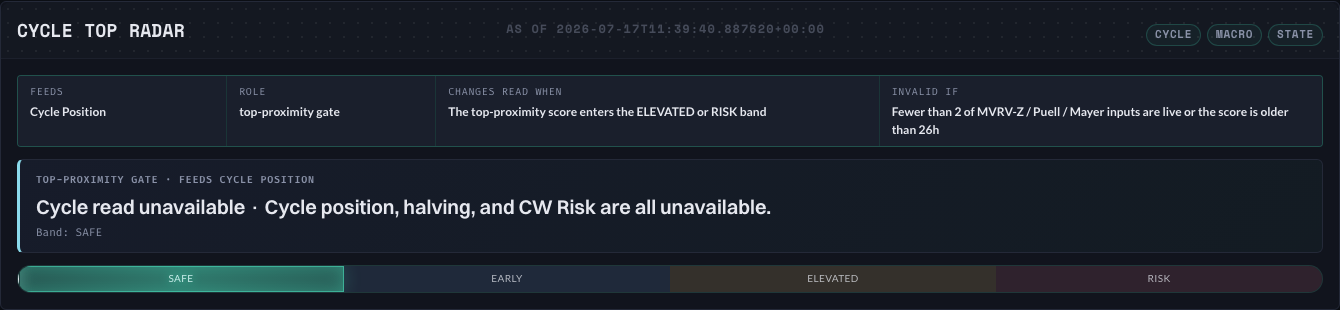
A persistent Bitcoin distribution phase (NONE → EARLY → ACTIVE → EXHAUSTION → POST_TOP_CONFIRMATION) plus independently honesty-gated 30-, 90-, and 180-day terminal-top horizons. It does not predict an exact top price or date.
The panel is retired (2026-08-08); the versioned artifact still feeds the planned de-risk budget in Action and the morning brief, and the top-proximity story is carried by CW Risk. Read the distribution phase first. Terminal-top percentages appear only after held-out calibration, freshness, and provenance gates pass. “No current call” or unavailable horizons are not zero-risk readings.
The phase escalates or cools, a planned de-risk bucket becomes eligible, or a horizon becomes publishable after its gates clear.
You treat phase as a guaranteed top, force a % while gates fail, or ignore post-ETF sample limits. Pre-ETF history does not auto-transfer.
Distribution is a process. A terminal top is an event. They are never collapsed into one score. The live product keeps process/phase readable while numerical probabilities stay dark until publication gates pass (including enough strictly forward held-out cycle folds).
When shown, the 20% / 50% / 30% split is a share of a user-declared de-risking budget (early distribution / valuation ladder / confirmed breakdown), labeled PLANNED / WAIT / ELIGIBLE — never automatic trade execution.
Full methodology: Cycle Top Radar.

Hot Capital Share (supply younger than three months from HODL wave bands) plus active supply unmoved for 1y+, 3y+, and 5y+, with a full age-band stack.
Low Hot Capital Share means old coins dominate (accumulation signature). High readings mean new speculative capital is elevated. Active supply 1y+ is HODL strength context, not a trade signal.
Hot Capital Share crosses a declared band (<13%, <16%, >20%, or >24%) for two or more consecutive prints.
HODL waves or Hot Capital Share is unavailable or older than seven days, or when you treat descriptive bands as a bottom or top call.
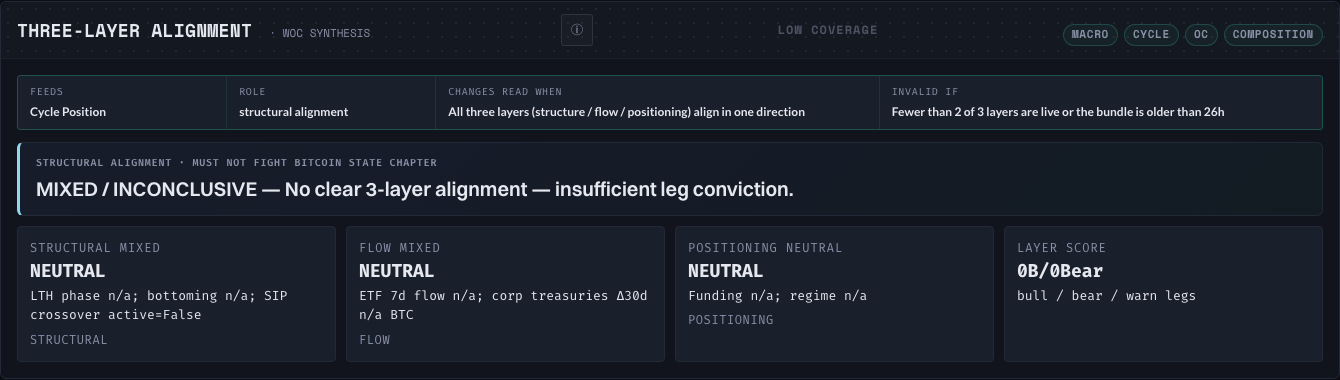
Whether structure, capital flow, and derivatives positioning tell the same directional story.
All aligned raises conviction. Two versus one is partial confirmation. Mixed means wait for the dissenting layer to resolve.
All three layers align or a previously aligned state breaks.
Fewer than two layers are live or the bundle is stale.
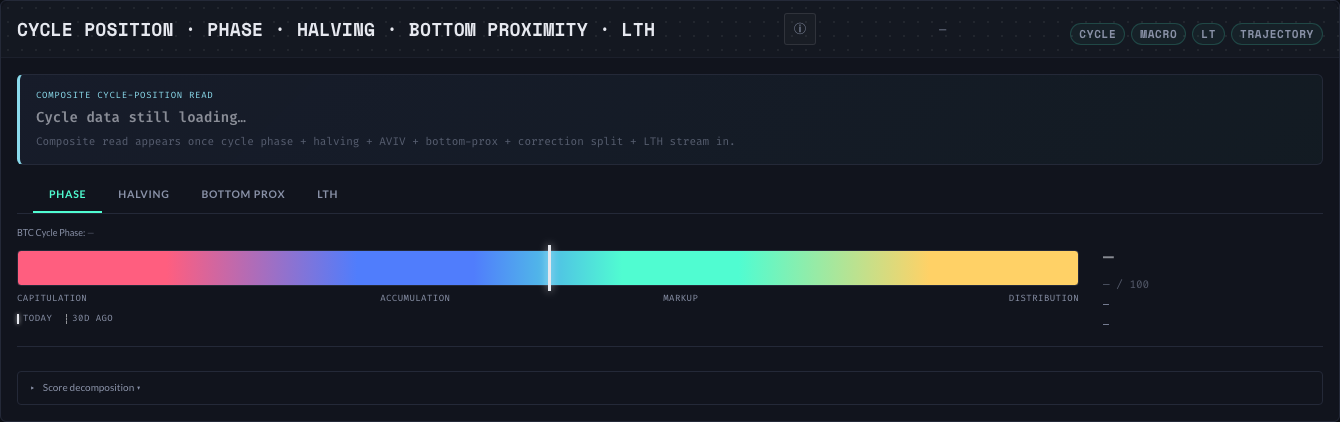
A four-stage gauge for the canonical categorical phase: Capitulation → Accumulation → Markup → Distribution.
Use the prominent phase label and current marker first. Bottoming, Cointime, Halving, value zone, LTH, Cowen, Hot Capital, and Three-Layer stay in closed receipts on this panel.
The canonical fresh cycle phase changes from one named stage to another.
The cycle-daily receipt is stale, stalled, missing, or unknown. The categorical phase is not a probability or time forecast.
Known company, miner, ETF, and government Bitcoin holdings plus concentration and 30-day demand change.
Rising holdings support structural demand. Concentration above 50% increases entity-specific risk even if total holdings rise.
Thirty-day demand changes sign or concentration crosses its risk threshold.
The holdings artifact is empty or older than seven days.
Seven-day average transfer volume from long-term holders to exchanges, split between coins moved in profit and at a loss.
Rising profit transfers suggest distribution. Rising loss transfers suggest stress or capitulation. Transfers are intent evidence, not proof of sale.
Loss transfers exceed 60% while total transfers rise, or sustained profit transfers accelerate.
The split or total moving average is unavailable.

Illiquid and long-term-held supply trends, which estimate how much float is unavailable to trade.
Rising illiquid supply means absorption and tighter float. Falling illiquid supply means previously dormant supply is becoming available.
The trend reverses across two or more consecutive readings.
The holder series is unavailable or older than seven days.

A synthesis of ETF flows, deployable-liquidity pipeline, stablecoin and reserve flows, and holder absorption.
Positive and broad receipts mean capital is entering. A single positive component with quiet activity means weak participation, not full confirmation. Open 24h · 30d · context as a sibling receipt on Liquidity — not inside the ETF / pipeline receipt.
ETF, pipeline, and money-flow components align or materially diverge.
Feeds are empty, stale, or use incompatible time windows.
Who is driving supply and demand across the same windows: long-term-holder supply, 7-day and 30-day ETF flow, corporate treasuries, and broad entity accumulation.
Start with the alignment label, then read each participant. “Recovering” means short-term ETF flow improved while the 30-day total remains negative; “split” means CryptoWatch will not force false confluence.
A major cohort changes stance or the four participant windows become aligned.
Coverage is missing, horizons are mixed without a label, or transfer activity is treated as confirmed selling.

M2 growth, dollar strength, real yields, Fed liquidity, yield curve, credit spreads, and BTC's cross-asset relationship.
Expanding money and easier financial conditions grant permission to bullish crypto signals. Dollar, rate, or credit stress can cap them.
Money, dollar, rates, or credit cross a declared regime boundary.
Monthly and daily inputs are compared without respecting freshness.
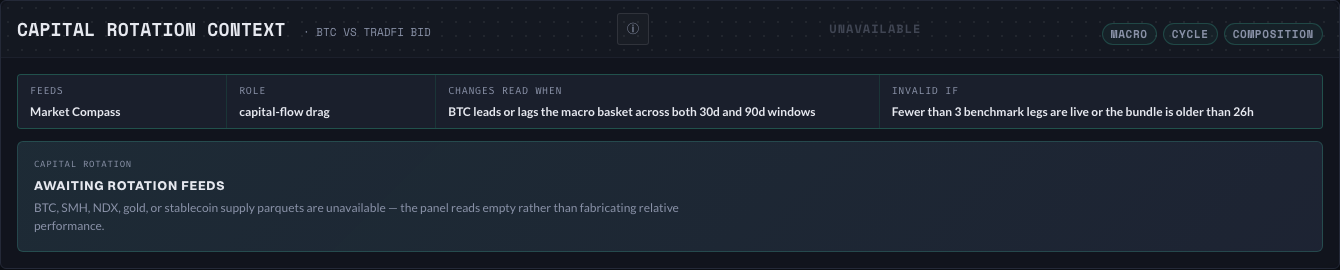
Bitcoin's 30-day and 90-day relative performance versus semiconductors, Nasdaq, gold, and other macro risk assets.
BTC leadership suggests crypto-specific demand. Broad risk assets leading BTC suggests capital is available but not yet rotating into Bitcoin.
Bitcoin leads or lags the comparison basket across both windows.
Fewer than three benchmark legs are live.
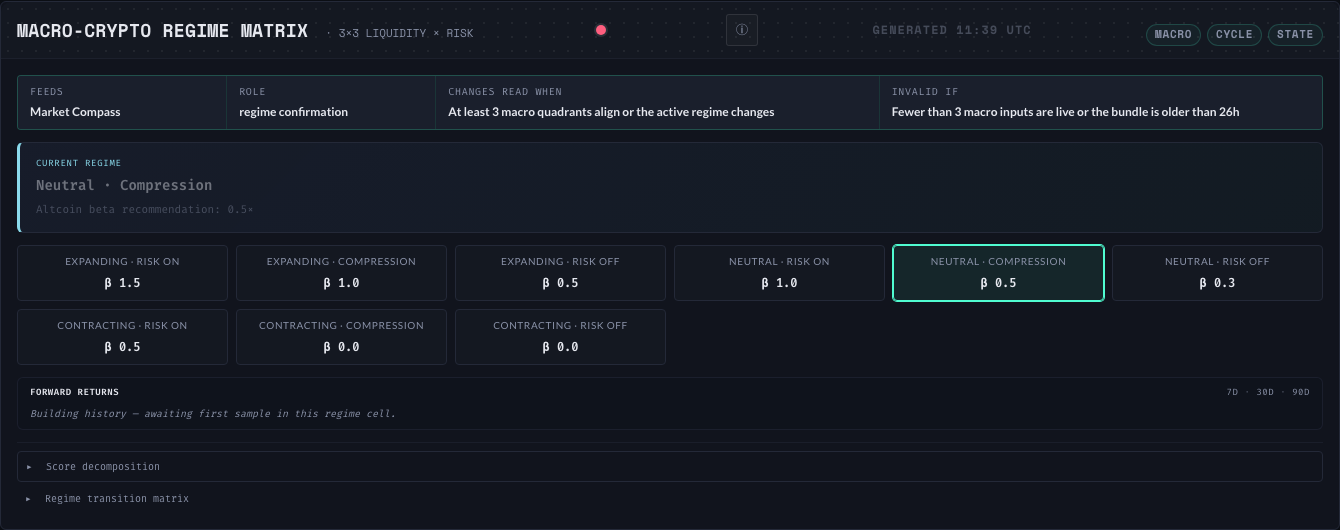
A 3×3 intersection of liquidity: expanding, neutral, contracting; and crypto risk: risk-on, compression, risk-off.
The panel is retired (2026-08-08) — its history is degenerate (all NEUTRAL_COMPRESSION) and the regime story is carried by Macro Permission (compass / regime radar is a closed receipt); the backend matrix still feeds the morning brief. Expanding plus risk-on supports exposure; contracting plus risk-off demands defense.
The active matrix cell changes or three macro quadrants align.
Fewer than three macro inputs are live.
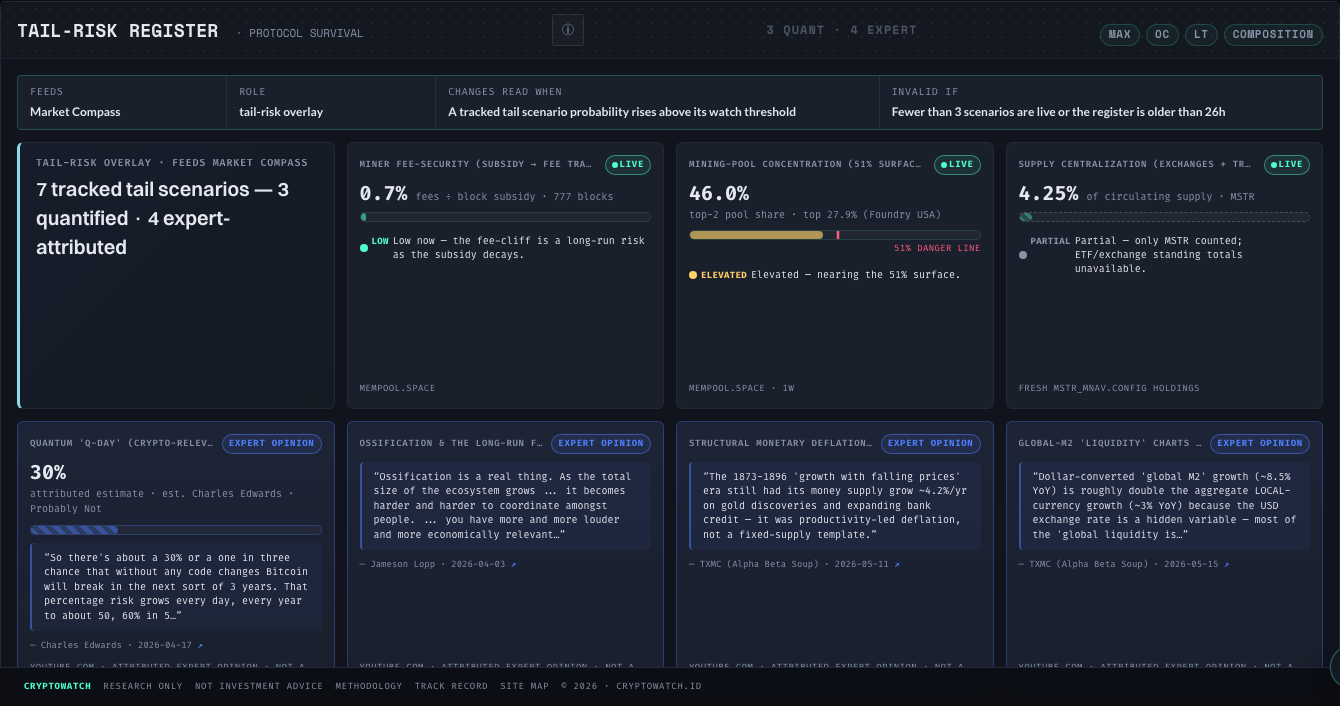
Live source-backed structural risks such as miner fee security, custody concentration, and mining-pool concentration.
These are thesis risks, not daily trading signals. Watch direction, threshold proximity, source window, and whether several risks worsen together.
A tracked current metric rises above its declared watch threshold.
The current timestamp is missing, a source is unavailable, or fewer than three current cards are returned.
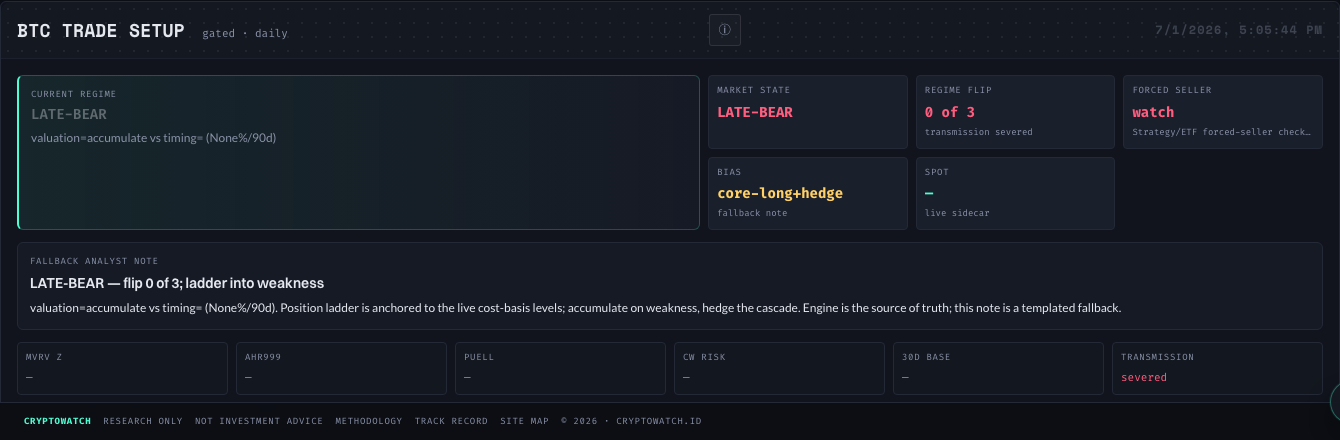
A deterministic plan built from live cost-basis levels, position ladder, regime gates, risk limits, and historical base rates.
Read regime, allowed posture, entry ladder, invalidation, and sizing in that order. A withheld setup means the gates did not permit precision. Timing, DCA map, where valuation waits, institutional sizing, and the price chart are sibling receipts — one click each.
Price enters a declared zone while regime and risk gates permit exposure.
Entry, stop, sizing, or the supporting snapshot is stale or withheld.
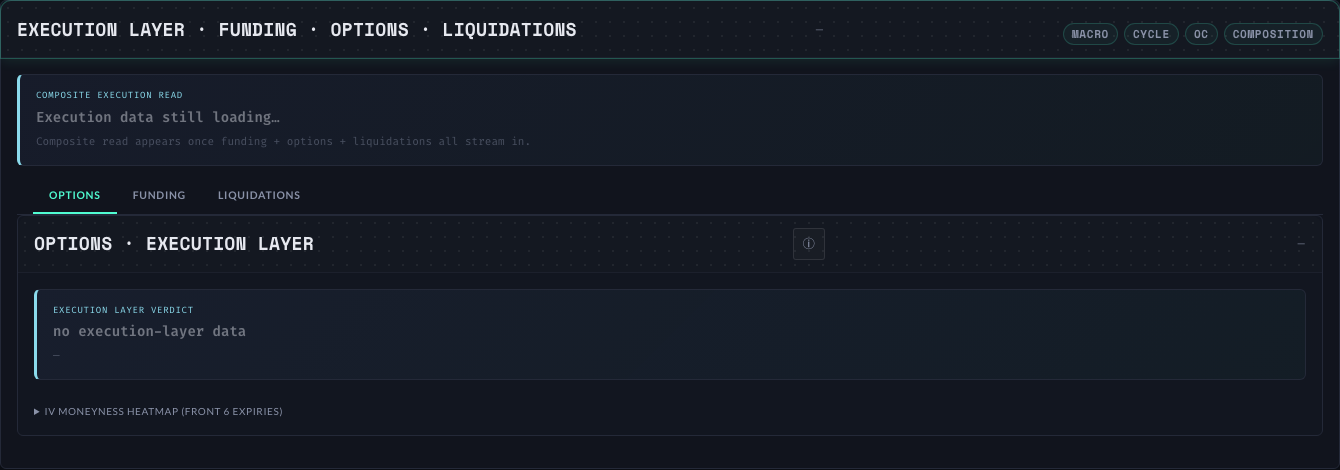
Four compact inputs: Funding, Options, Liquidations, and Contrarian. Each row reports state, one value or range, freshness, Action relevance, and invalidation or unavailable reason.
The layer synthesizes the four rows as ALIGNED, MIXED, or UNAVAILABLE. This is execution-timing evidence for the existing Action thesis, not a second trade recommendation.
Current rows align around crowding, squeeze, volatility, or liquidation risk strongly enough to change entry timing or patience.
Required receipts are stale or missing, estimated liquidation zones are treated as measured orders, or a single derivatives input is used as a cycle call.
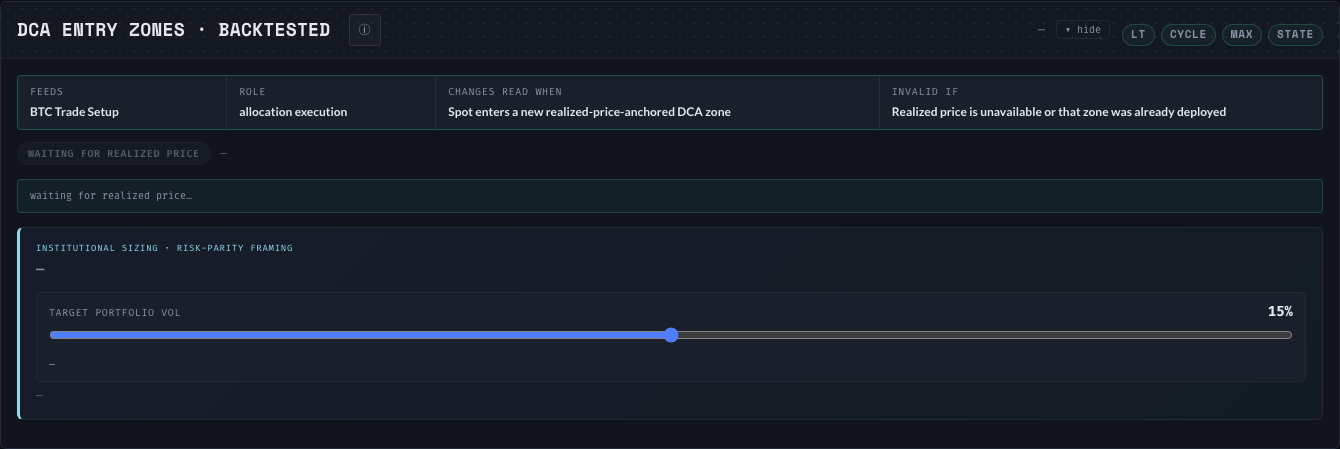
A research-only planning ladder anchored to Realized Price, LTH Realized Price, STH Cost Basis, True Market Mean, and cohort-cost levels, with reference shares by zone.
Existing provenance is the current DCA plan, BTC Setup, and price-level/candle/cost-basis receipts. The hybrid plan sits on the DCA map receipt. The zone ladder is the sibling “where valuation waits” receipt on BTC Setup — not nested inside the map. Use zones and price levels to understand cadence and dry-powder tradeoffs; deeper zones describe historical stress, not a promised rebound or portfolio weight.
A daily close crosses a referenced level or planning zone and the broader evidence changes with it.
Fail closed and mark the map unavailable when a receipt, its source or as-of is missing or stale, a planned share is counted twice, or planning zones are treated as observed execution. CryptoWatch records no observed execution.
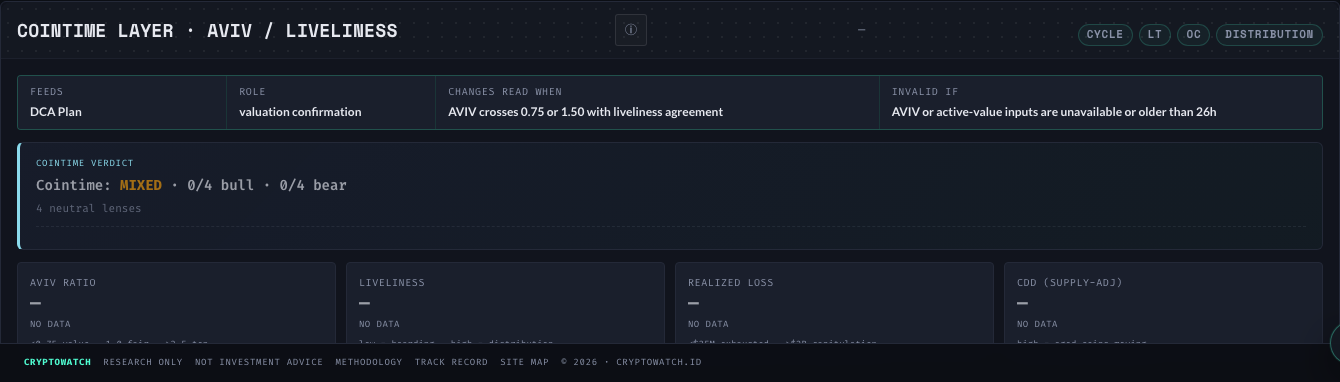
AVIV and liveliness, which weight valuation by economically active versus dormant coin supply.
Low AVIV suggests active-value compression; high AVIV suggests stretched valuation. Liveliness shows whether old supply is becoming active.
AVIV crosses 0.75 or 1.50 and liveliness agrees.
AVIV or active-value inputs are missing or stale.
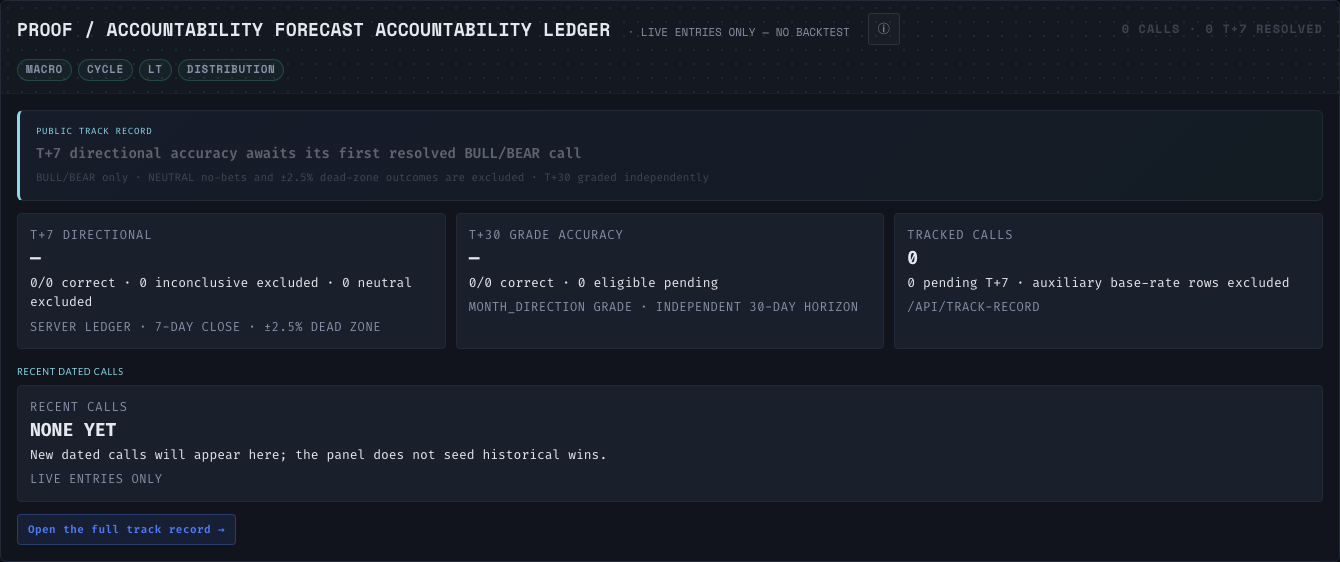
Resolved directional calls plus a separate daily receipt trail for every on-chain evidence family: observation count, state changes, persistence, regime, and later 7/30/90-day price context.
Use forecast calibration for actual calls. Use interpretation receipts to verify what the evidence said and when it changed. Forward returns beside descriptive states are context—not forecast wins.
A call resolves, or a daily evidence family changes state enough to alter the five-decision synthesis.
Descriptive state receipts are mislabeled as price predictions, or small samples are presented as proven reliability.
CryptoWatch is where serious crypto decisions get made.
Macro tells you if and when to be exposed — with scored inputs across macro, cycle, on-chain, and execution synthesized into a single verdict.
Action keeps posture, sizing context, and invalidation attached to that verdict.
One read for the decision. One clear path to what changes it.
Macro is organized as five Decision Canvases — Now · Cycle · Money · Macro · Action — with 10 visible owners: five primary, 4 supporting, and one Proof / Accountability utility. Each canvas keeps one primary answer above its supporting evidence, and every conclusion has one visible owner. Supporting signals start closed. Bitcoin State holds the complete thesis; Macro keeps each decision concise. Decision Integrity remains the Now trust brake; CW Risk remains the Cycle valuation thermometer. Bottoming, Cointime, LTH→exchange, treasuries, Compass, tail-risk, timing rows, and DCA live as closed receipts on those owners.
Macro shows what the data says, where the data disagrees, and what a disciplined allocator can do with that read. The Bottoming process receipt on Cycle Position owns the bottoming read; CW Risk carries the top-proximity story — without claiming exact bottoms or tops.
Because the tools that exist are either raw data dumps (on-chain analytics platforms, exchange-flow services — here's 200 charts, figure it out) or black-box signals (pay us, trust us, we'll tell you when to buy). Neither respects how a thoughtful trader actually makes decisions.
A real cycle decision requires checking macro liquidity, cycle timing, on-chain stress, derivatives positioning, institutional flows, and sentiment — simultaneously. No single data source covers all of them. We wanted one screen that does, with a framework that explains exactly how each signal contributes to the verdict.
| Category | Typical platforms | CryptoWatch |
|---|---|---|
| On-chain analytics | Raw on-chain data. You build your own dashboard. | Pre-synthesized composite. Every indicator is scored, weighted, and explained. |
| Cycle-chart aggregators | 200+ charts. Expert commentary. No single verdict. | One gauge, one number, one verdict — with the full breakdown visible when needed. |
| Exchange-flow services | Exchange flows and alerts. Professional data tools. | Flows are one input across four evidence layers, weighed against macro, cycle, on-chain behavior, and derivatives positioning. |
| Charting platforms | Charts and indicators. You interpret everything. | Interpretation is the product. CryptoWatch takes a position and shows its work. |
| Paid signal groups | “Buy now.” No reasoning. No accountability. | Full reasoning chain. Accuracy tracked publicly. Every call has a confidence level. |
Macro: Cycle intelligence, not day-trading signals. Built for the question "where are we in the 4-year BTC cycle?" and its practical follow-ups: should I be accumulating, holding, or distributing? At what size? With what conviction?
Make cycle intelligence and narrative alpha accessible. The data that drives billion-dollar fund decisions should be readable by anyone with 5 minutes a day and a browser.
A world where no retail crypto investor gets caught on the wrong side of a cycle turn — or chases a narrative peak — because they didn't have access to the right data in the right format at the right time.
Other platforms give you charts, raw data, and exchange flows. CryptoWatch gives you the verdict — and shows its work.
cryptowatch.id is a live BTC intelligence layer: Bitcoin State for the complete thesis, Macro for five daily decisions, and Track Record / Ledger for accountability. The composite gauge still synthesizes macro, cycle, on-chain, and derivatives evidence into a signed verdict band — while cycle extremes are process-first (Cycle Position bottoming receipt / CW Risk top-proximity) and fail closed on uncalibrated percentages.
The dashboard exists because most "crypto dashboards" pick one lens (just on-chain, just TA, just sentiment) and miss the rest. Real cycle turns happen when macro, cycle position, on-chain cohort behavior, and derivatives positioning all line up. We wanted a single surface that shows whether they do.
Every number on the dashboard is computed live from primary sources. Nothing is hand-entered. Nothing is hardcoded. If the backend pipeline goes down, the number goes stale and the UI says so.
This is not a signal service. It does not tell you when to buy or sell. It shows you what the underlying data says right now, in a single view, with all the math visible. The verdict is a summary of conditions, not a trade recommendation. Read the disclaimer.
A 6-step session workflow. Open the dashboard, go through these in order. Each step narrows the evidence behind the five decisions and shows whether the current posture has support, conflict, or no edge.
The first thing you see. The gauge sums 21 signed scores into a single number from −24 to +24 and maps it to one of 7 verdict bands. Read two things:
If the verdict is WAIT (score −2 to +1), the evidence has no directional edge. Review the conflicts and invalidation conditions instead of forcing a conclusion.
L4 is the trigger layer. It tells you whether the derivatives market is already crowded in one direction. Open the Timing rows receipt on BTC Setup (Funding, Options, Liquidations, Contrarian). This matters more than anything else for timing, because extreme positioning resolves in 1-4 weeks, not months.
L3 is the cohort layer. It answers: "is the on-chain population actually at a stress point, or is this just derivatives noise?" Classic Tier 1 confluence still informs scoring; the live confirmation count is the Bottoming process receipt on Cycle Position.
Tier 2 is the confirming layer — softer triggers like LTH MVRV < 1, US Spot Premium positive, Liveliness falling. Tier 2 alone does not establish a bottom; it raises the priority of watching the Tier 1 confirmation gates.
L2 is the slow map. It won't change between sessions — that's the point. Read:
X/6 PASS/OPEN confirmation gates, invalidations, likelihood receipt.L1 is the override layer. If macro is hostile, even extreme undervaluation can get cheaper. Read:
2022 is the textbook reason L1 exists. On-chain looked "cheap" for 6 months while DXY rallied 20% and BTC fell another 40%. L1 kept the bullish evidence qualified until the macro headwind eased.
On BTC Setup, open the sibling receipts separately. The DCA map holds the hybrid plan. The zone ladder is “where valuation waits.” Institutional sizing is its own receipt. Zones are planning context, not instructions or observed execution:
Once you know the flow: 3-5 minutes a day. The point of a composite framework is that most of the work is already done for you. You're reading a verdict, verifying it against 2-3 confirming signals, and checking L1 for a veto. That's it.
Context earns dashboard space only when it names the verdict it feeds, the threshold that can change that verdict, its invalidation condition, and its freshness boundary.
Supporting Macro evidence receipts begin with the same four fields: Feeds names the primary decision owner; Role explains whether the evidence confirms, times, filters, or executes that decision; Changes read when states the measurable escalation threshold; and Invalid if states when the evidence must be ignored. The current synthesis line remains the live read; the rail is the stable methodology contract.
The five former public evidence services (intraday delta, social emergence, mindshare, OSINT health, daily debate) were retired on 2026-07-15 with their Tier-C producer stack. They are not part of the current public contract.
The framework asks four evidence questions across Macro, Cycle, On-Chain, and Execution. The Observatory synthesizes those answers into five user decisions: Now, Cycle, Money, Macro, and Action. Bitcoin State reconnects them into one complete thesis.
The permission layer. Macro doesn't tell you to buy or sell BTC. It tells you whether BTC-specific signals are allowed to work. When M2 is expanding and DXY is weakening, crypto-native bullish setups resolve normally. When the opposite is true, they get overwhelmed by capital flight. L1 is the binary that decides whether the other 3 layers matter.
The slow map. This layer barely changes week-to-week. It tells you which phase of the 4-year halving cycle we're in: accumulation, markup, distribution, or bear. L2 is the context that determines what L3 and L4 readings actually mean. A funding spike at day 480 post-halving means distribution is starting. The same funding spike at day 950 post-halving means shorts are capitulating.
The behavioral layer. This is BTC's unique advantage over every other asset — we can see what every holder cohort is actually doing on-chain. L3 tells you whether long-term holders are hoarding or distributing, whether short-term holders are in profit or underwater, whether miners are capitulating, whether institutional spot flows are positive. L3 is where the real bottom and top signals live.
The trigger layer. The fastest-moving layer. L4 reads the derivatives market for crowded positioning — funding rates, open interest, implied volatility, skew. L4 won't call a cycle bottom by itself. But it's what separates a 6-week-early call from a same-week entry. When L2 and L3 say "bottom is close" and L4 says "shorts are at −190% annualized funding," that's the moment.
These four evidence layers are read in sequence when signals conflict:
Cycle extrema are evaluated one canonical top and bottom per Bitcoin cycle. Adaptive thresholds use only observations strictly before each scored date. Missing historical feeds are excluded from the denominator, and distinct false-alarm episodes are reported outside the event windows.
The current receipt covers three pre/post-ETF cycle tops and three pre-ETF bottoms. There is only one completed post-ETF top and no completed post-ETF bottom, so both engines remain calibrated=false. The current bottom is a live candidate and the first post-ETF bottom validation sample—not a backtest win.
The five public decisions — Now, Cycle, Money, Macro, and Action — sit above four evidence layers. Each layer answers a different question and contributes signed scores to the composite; the layers are evidence organization, not a second navigation system.
Question: is the global environment supportive of risk assets, or is it pulling capital out?
Bitcoin does not exist in a vacuum. When the US dollar strengthens and global liquidity contracts, even a perfect on-chain setup struggles. When M2 is expanding and DXY is rolling over, the same on-chain setup becomes a launchpad. L1 is the permission slip.
Signals: US M2 year-over-year · DXY 3-month change · BTC–SPX 30-day correlation regime.
Question: where are we in the 4-year Bitcoin cycle — capitulation, accumulation, markup, or distribution?
Cycle position is the slow-moving map underneath everything else. It blends time-based features (halving framework), technical regime (weekly MA stack), valuation (AVIV Ratio from Cointime Economics), and composite bottom-proximity scoring. This layer is what separates a "dip" from a "bottom" and a "pullback" from a "top."
Signals: MA Stack Regime Score · AVIV Ratio · Halving regime · Bottom proximity composite · Drawdown from ATH.
Question: is the on-chain population under stress, taking profits, or still distributing?
L3 is the cohort layer. It reads what long-term holders and short-term holders are actually doing on-chain, separates them by age, measures profit/loss behavior, and tracks institutional flow through spot ETF activity and US spot premium. This layer catches real bottoms before price does.
Signals: Zero-FP Tier 1 confluence · LTH MVRV · STH MVRV · Liveliness / Vaultedness · Realized Loss · US Spot Premium · IBIT activity multiplier · LTH SOPR.
Question: is now the actual moment — is derivatives positioning primed to squeeze, or is the crowd already one-sided?
L3 can say "bottoming evidence is building." L4 asks whether shorts are crowded and volatility is stressed now. It contributes timing evidence; CryptoWatch does not place or observe trades.
Signals: BTC funding annualized · DVOL · IV term structure shape · 25Δ skew proxy · OI / market cap.
Every indicator contributes a signed score in the range −2 to +2 by default. After layer-strength multipliers (see "Multipliers and bounds" below) the per-indicator score is clamped to ±3. Quality-weighted L1–L4 rows sum on a fixed 21-slot universe; the display total maps to one of seven verdict bands on a ±24 scale.
Live Macro posture and the composite gauge prefer the server-built score embedded on
/api/cw/snapshot as composite (module
composite_score.py, FE-parity with the browser scorer).
The client rebuild remains only as a fallback when the server block is missing
(or when ?weights=v1 forces equal-weight comparison). Historical
cycle time-machine and glassnode-signals GET /composite use the same scorer.
+2 = strongly bullish (extreme undervaluation, capitulation, panic, or crowded short positioning).
+1 = mildly bullish (undervalued or supportive).
0 = neutral / no signal.
−1 = mildly bearish (overvalued or stretched).
−2 = strongly bearish (euphoric distribution, crowded long positioning, or extreme complacency).
The naive sum of 21 × ±2 would be ±42. The dashboard caps the displayed total at ±24 via two mechanisms:
composite_score.py / FE buildCompositeScore.?weights=v1.composite_verdict.py). The ±24 range is a bounded synthesis convention — not a calibrated probability scale.| Score range | Verdict | Meaning |
|---|---|---|
| ≥ +16 | STRONG BUY | Multiple layers at capitulation extreme, derivatives crowded short, high-conviction bottom window |
| ≥ +8 and < +16 | BUY | Cycle + on-chain both align bullish, derivatives not yet fighting the setup |
| ≥ +2 and < +8 | MILD BUY | Conditions lean bullish but conviction is partial — one or two layers still neutral |
| > −2 and < +2 | WAIT | Indicators disagree or cancel out — no edge |
| ≥ −8 and ≤ −2 | MILD SELL | Conditions lean bearish — late-cycle risk appearing in one or two layers |
| ≥ −16 and < −8 | SELL | Cycle + on-chain align bearish, derivatives confirm distribution |
| < −16 | STRONG SELL | Multiple layers at euphoric extreme, high-conviction top window |
Alongside the score, the gauge shows a confidence percentage built from a fixed 21-indicator universe:
A +8 score with 90% confidence means "most indicators agree and most of the expected slots are live." A +8 score with 55% confidence means "the total is being driven by a thinner or more conflicted set of signals."
The composite score is not probabilistic. A +17 STRONG BUY does not mean "71% chance of going up." It means "conditions match historical bottom setups." Historically those setups have preceded multi-month rallies — but Bitcoin has done things that have never happened before, and will again. Use the gauge as a synthesis of conditions, not a win-rate.
The gauge is the one-number summary. These rules explain how evidence changes the five-decision posture when layers agree or conflict. They do not prescribe allocation or execute trades.
All four layers aligned is the strongest evidence state in the framework, but it is not unambiguous and does not prescribe position size. Apply the current cycle state, invalidation, and your own risk plan.
L1 Macro: M2 starting to re-expand, DXY rolling over from +20% peak → +1
L2 Cycle: MA Stack 0/4, AVIV 0.67, halving regime late bear, drawdown −77% → +7
L3 On-Chain: Tier 1 4/4 triggered, LTH MVRV 0.82, LTH SOPR 0.78, realized loss $18M/day → +7
L4 Positioning & Timing: BTC funding −190% annualized, DVOL 94, IV backwardation, 25Δ skew −12 → +2
Composite: +17 STRONG BUY. Every indicator except a few L1 variables at or near maximum confluence.
Interpretation: the four evidence layers strongly aligned around a historical bottom setup. That raised conviction, but the score did not prescribe a portfolio weight or prove the low in real time.
The most common edge case: on-chain and cycle position suggest a possible accumulation zone, but derivatives positioning does not confirm the timing. The composite should stay cautious until that conflict resolves.
L1: M2 contracting, DXY +15% YTD → −2
L2: AVIV dropping toward 0.75, halving regime mid-bear → +3
L3: Tier 1 1/4 triggered (MVRV briefly crossed <1 on LUNA collapse), NUPL barely negative → +1
L4: Funding still positive, OI/Mcap at 3.8% (overleveraged), no panic in IV → −1
Composite: +1 WAIT. Framework said wait.
Why the composite stayed WAIT: Only 1 of 4 Tier 1 signals fired and L4 still showed overleveraged longs. The evidence was incomplete; broader capitulation arrived five months later at FTX.
The lesson: partial Tier 1 stress is not a confirmed bottom. Require independent cycle, cohort, and positioning evidence before increasing confidence.
Macro headwind delays even extreme undervaluation. This is the hardest rule to follow emotionally because on-chain will be screaming "cheap" while price keeps dropping.
AVIV dropped below 0.80 (historical accumulation territory) in July 2022. On-chain metrics suggested the bottom was near. But M2 was contracting at −1.5% YoY and DXY was at +18% 3-month change. L1 was maximally hostile.
What actually happened: BTC fell from $22K in July to $15.5K in November — another 30% downside. L1 correctly identified that apparently cheap on-chain conditions still faced a powerful macro headwind.
Rule: when L1 is hostile (M2 contracting AND DXY rising), downgrade bullish posture and require fresh confirmation from the other layers. CryptoWatch does not convert that evidence into a portfolio percentage.
| Condition | Evidence implication |
|---|---|
| L1 Macro hostile (M2 YoY < −2% AND DXY 3m > +5%) | Downgrade bullish posture even when L2/L3 are supportive |
| L4 Funding > +54% annualized | Crowded-long warning; bearish confirmation strengthens if L3 also weakens |
| L4 Funding < −54% annualized | Adds conviction if L2+L3 already support. Not sufficient alone. |
| L3 Tier 1 count = 0/4 | Bottom thesis lacks cohort confirmation |
| L3 Tier 1 count = 1-2/4 | Partial stress evidence; watch for additional independent confirmation |
| L3 Tier 1 count = 3-4/4 | Strong historical confluence; still require current recovery and invalidation checks |
| L2 AVIV < 0.75 | Historically deep valuation zone; not a guaranteed floor |
| L2 MA Stack 4/4 + AVIV > 2.0 | Distribution risk is elevated; verify with current flow and positioning evidence |
| L2 halving regime = distribution_danger | Default to caution even if L3/L4 look bullish. Top window. |
The rules require more evidence to strengthen a posture than to flag a risk. That conservatism is intentional: an early bottom call can remain wrong for months. Use the framework to compare evidence, confidence, and invalidation—not as an allocation formula.
Why 21 indicators and not 10. Why ±2 scoring and not raw values. Why some indicators are symmetric and some aren't. Why the verdict bands land at ±16 and ±8. These are not arbitrary choices — they're deliberate decisions with backtest rationale.
The framework needs to cover 4 independent dimensions (macro, cycle, on-chain, positioning and timing) without missing signal and without becoming noise. We landed on 21 after testing configurations from 8 to 35. The distribution:
Fewer than 21 leaves blind spots. In testing, 15-indicator versions consistently missed either miner capitulation signals or IV term structure reversals. More than 21 crosses into diminishing returns — each additional indicator contributes less signal while adding correlated noise and computation load. 21 is where backtest accuracy plateaus.
Every indicator uses different units. M2 YoY is a percentage. MVRV is a dimensionless ratio. Realized Loss is dollars per day. Funding is an annualized percentage. You can't sum them directly. A normalized score per indicator (−2 extreme bearish to +2 extreme bullish, 0 neutral) makes them addable and comparable.
Why specifically ±2 and not ±1 or ±3?
Not every indicator scores symmetrically. Some push harder in one direction than the other. These aren't bugs — they're deliberate.
| Indicator | Range | Why asymmetric |
|---|---|---|
| M2 YoY | −2 to +1 | Contracting M2 is a deep structural headwind — worth full −2 weight. Expanding M2 is a tailwind but never a trigger by itself, so +1 is enough. |
| DXY 3m | −1 to +1 | DXY is a regime context, not a direct trigger. Capped at ±1 so it can't dominate crypto-native signals. |
| BTC-SPX 30d correlation | 0 only | Pure regime indicator — tells you which other indicators matter. Never directional. Always scored 0. |
| Drawdown from ATH | −1 to +2 | Being near ATH isn't automatically "sell" (bull markets stay near ATH for months). But a >70% drawdown is strongly bullish because every historical cycle bottom had one. |
| Tier 1 triggered count | −1 to +2 | 0/4 just means "no bottom signal active right now" — not "sell." It's neutral-to-mildly-cautious. But 3-4/4 is historically unique to final cycle lows, so it deserves the full +2. |
| DVOL | −1 to +2 | High DVOL = panic priced in = historically coincides with bottoms, full +2. Low DVOL is only mildly bearish (complacency warning, not a top signal by itself). |
| IBIT Activity Multiplier | −1 to +2 | Activity surges happen at both tops (FOMO) and bottoms (panic buying). Needs L2 context to read direction. Capped upside so it can't drive the composite alone. |
The 7 bands (−24 to +24) are heuristic action bands replayed against historical cycle extremes. They are not statistically calibrated probabilities. Cycle top/bottom claims use the separate walk-forward event receipt, including coverage and false alarms.
| Range | Verdict | Historical backtest |
|---|---|---|
| ≥ +16 | STRONG BUY | 2015-01-14 bottom (+19), 2018-12-15 bottom (+18), 2022-11-21 FTX bottom (+17). 3 of 3 major cycle bottoms landed in this band. |
| ≥ +8 and < +16 | BUY | Mid-accumulation phases, 4-6 months after final lows. Strong conviction but not max confluence. |
| ≥ +2 and < +8 | MILD BUY | Early accumulation, partial setup. Current 2026-04-14 reading sits here at +7. |
| > −2 and < +2 | WAIT | Indicators disagree or cancel out. No edge. Dry powder. |
| ≥ −8 and ≤ −2 | MILD SELL | Early distribution warnings. |
| ≥ −16 and < −8 | SELL | 2021-04-14 first top, 2025-08 pre-top. Distribution confirmed. |
| < −16 | STRONG SELL | 2021-11-09 cycle ATH (−18). 2025-10-06 ATH landed at −8 because the 2025 top was shallower than prior cycles (diminishing extremes). |
±16 is the strongest confluence band, ±8 is the "conviction grows" line, and ±2 is the noise floor. These are decision conventions, not a claim of >80% precision.
The classical absolute thresholds largely missed the 2025 price top. The corrected engine does not lower every target to the 2025 reading. It combines trailing cycle-relative extremes with a post-ETF exhaustion pattern: several valuation metrics have rolled over from prior highs while price remains near a trailing one-year high. Future cycles remain walk-forward; no future reading is used to tune its own threshold.
Every scored indicator, in order, with its endpoint, logic, and scoring bands. This is the full source-of-truth for what the dashboard is computing.
US M2 money supply year-over-year change. The slow-moving global liquidity oscillator. BTC cycle highs correlate strongly with M2 expansion peaks; cycle lows correlate with M2 bottoms.
BTC has had a ~80% rolling correlation with global M2 liquidity since 2013. Crypto is a long-duration, risk-on asset that breathes in lockstep with the money supply. When M2 expands, risk capital flows into the longest-duration assets (tech stocks, emerging markets, crypto). When M2 contracts, the flow reverses. M2 isn't a trigger — it's the permission slip.
We use US M2 as a proxy for global liquidity because it's the largest single component and updates weekly. The ideal indicator would blend US M2 + ECB M2 + PBOC M2 but the correlations are tight enough that US alone captures the regime.
| Date | M2 YoY | BTC context |
|---|---|---|
| 2020-06 | +24.7% | Fed pandemic QE — start of the 2020-2021 bull run |
| 2021-11 | +13.1% | Peak of 2021 bull + cycle ATH |
| 2022-06 | +5.9% | Fed tightening — LUNA collapse, M2 growth decelerating |
| 2022-12 | −1.3% | First M2 contraction in decades — coincided with cycle low |
| 2024-04 | +0.7% | Halving + post-contraction stabilization |
M2 is slow — it reflects economic conditions with a 3-6 month lag. When M2 starts contracting, BTC often rallies for another 2-3 months before capitulating. Conversely, M2 re-expansion can lag the cycle bottom by weeks.
Mitigation: never use M2 as a timing signal. Use it as a context filter: contraction lowers confidence in bullish crypto-native evidence, while expansion removes that headwind. Timing evidence comes from L3 + L4.
| Condition | Reading | Score |
|---|---|---|
| Accelerating positive | YoY > +3.0% | +1 |
| Positive but decelerating | 0% < YoY ≤ +3.0% | 0 |
| Flat / declining | −2.0% < YoY ≤ 0% | −1 |
| Contracting | YoY ≤ −2.0% | −2 |
Dollar Index 3-month percent change. A strengthening dollar pulls capital out of risk assets; a weakening dollar fuels them. Historically the cleanest macro wind at BTC's back is DXY rolling over after a multi-month rally.
The US Dollar Index has the cleanest inverse correlation with BTC of any single macro variable. A rising dollar pulls global capital into USD-denominated assets (Treasuries, US equities). A falling dollar pushes capital into risk assets. The 3-month change captures the trend without reacting to daily noise.
We use DXY instead of the trade-weighted dollar because it's more liquid, updates in real time, and captures the same signal. The 3-month lookback is long enough to filter weekly chop but short enough to flag regime changes within a cycle.
| Date | DXY 3m | BTC context |
|---|---|---|
| 2022-07 | +7.2% | DXY rally crushed risk assets. BTC fell from $30K to $19K. |
| 2022-11 | +1.1% | DXY peak. BTC cycle low 2 weeks later. |
| 2023-01 | −4.8% | DXY rolling over. BTC bottomed, started recovery. |
| 2024-04 | +1.2% | Halving-week DXY stable. Neither tailwind nor headwind. |
| 2025-09 | +3.1% | Pre-cycle-top DXY strength. Distribution warning. |
DXY weakness can coexist with weak BTC during risk-off regimes (2018 bear market, DXY was flat-to-weak but BTC fell 84%). DXY is a necessary but not sufficient condition for BTC strength.
Mitigation: DXY is scored ±1 max (not ±2) precisely because it's a soft regime indicator. It can't drive the composite alone — it amplifies or dampens crypto-native signals.
| Condition | Reading | Score |
|---|---|---|
| Dollar strengthening (risk-off) | Δ3m > +2.0% | −1 |
| Range-bound | −2.0% ≤ Δ3m ≤ +2.0% | 0 |
| Dollar weakening (risk-on) | Δ3m < −2.0% | +1 |
Rolling 30-day correlation between BTC and the S&P 500. This is a regime indicator, not a directional one. When correlation is high (>0.6), BTC is moving with risk assets and macro dominates. When correlation is low or negative, BTC is trading on its own narrative. Reported as context only — scored neutral (0).
This isn't a directional signal — it's a regime classifier. When BTC-SPX correlation is high (> 0.6), BTC is trading as a risk asset and macro conditions dominate. When correlation is low or negative, BTC is trading on its own narrative (halving, ETF flows, on-chain events) and L3 signals matter more.
We keep it in the framework scored at 0 (no direct composite contribution) because its job is to tell you which other indicators to weight heavily. High correlation → L1 Macro matters more. Low correlation → L3 On-Chain matters more. It's a meta-indicator.
| Date | Corr | Regime |
|---|---|---|
| 2020-03 | 0.92 | COVID crash — crypto sold as risk asset, maximum correlation |
| 2021-02 | 0.28 | Crypto-native bull — BTC decoupled, halving narrative dominant |
| 2022-06 | 0.78 | Macro bear — BTC tracked tech stocks down on every Fed meeting |
| 2024-01 | 0.35 | Spot ETF narrative — BTC decoupled from macro |
| 2025-03 | 0.51 | Mid-cycle, neither regime clearly dominant |
Correlation alone doesn't tell you direction. High correlation to a falling SPX is bearish; high correlation to a rising SPX is bullish. Mitigation: always read correlation alongside DXY and the SPX trend itself. The indicator is scored 0 by design — it only changes how you read the other indicators.
Federal Reserve total assets ($T). QE = Fed buying bonds = liquidity injected into markets = risk-asset tailwind. QT = Fed running off holdings = liquidity drained = risk-asset headwind. Often called "THE most important macro signal for crypto" because BTC's multi-year cycles line up with Fed balance sheet expansion and contraction.
4w change: ≥+0.5% = QE (risk-on), −0.5% to +0.5% = stable, ≤−0.1% = QT mild, ≤−0.5% and 52w ≤−2% = QT accelerating (strongest headwind). Weekly series released Wednesdays; 4-row lookback ≈ 4 weeks.
Difference between the 10-year and 2-year US Treasury yields. Inversion (spread < 0) preceded every US recession since 1955 with a ~12-month lead. Crypto, being a long-duration risk asset, typically follows the risk-asset cascade 6-18 months after inversion normalizes upward.
<0pp = inverted (recession warning), 0-0.5 = flat, 0.5-2.0 = normal, >2.0 = very steep (post-recession recovery signature). We surface "days since sign flip" so you can gauge how fresh the current regime is.
Money market funds park cash at the Fed's overnight reverse repo facility — effectively removing it from risk markets. Peak was ~$2.5T in late 2022; drained below $1B through 2025. Draining RRP = capital flowing back into markets (risk-on tailwind); absorbing RRP = flight-to-safety (risk-off drag). $100B/30d is historically meaningful; $20B/30d matters in the current low-balance regime.
Inflation-adjusted return on a 10-year Treasury — the opportunity cost of holding non-yielding crypto. Negative real yields = TradFi can't beat inflation = strong crypto tailwind (2020-2021 cycle). >2% = restrictive, meaningful crypto headwind (2024 environment).
<−1pp deeply negative (strong tailwind), −1 to 0 accommodative, 0 to 1 neutral, 1 to 2 tight, >2 restrictive (heavy headwind).
The risk-appetite thermometer. Widening HY spreads = credit stress = risk-off across all assets. Crypto mirrors HY credit cycles tightly — during 2022's credit crunch HY blew out and BTC drew down with it; 2024's narrowing spreads coincided with BTC's rally to new highs.
<3% complacency (risk-on bias), 3-5% normal, 5-8% stressed (risk-off), >8% crisis.
The classic "fear gauge." Sub-15 = complacency (historically precedes corrections), 20-30 = caution, >40 = panic. Crypto tends to follow VIX spikes into drawdown and recover on VIX collapse — the intraday sentiment specialist of the macro stack.
Industrial metals bellwether. Copper is consumed everywhere — construction, EVs, grid, electronics — so its price tracks global growth expectations. Rising copper = cyclical demand expansion (risk-on for crypto); falling = recession whispers. 90d horizon because copper is noisy day-to-day.
>+8% strong growth, +2 to +8 expanding, −2 to +2 neutral, −8 to −2 contracting, <−8 recession-like.
CNY weakening vs USD historically signals Chinese capital outflow pressure — a bearish crypto signal since a material share of crypto flow has historically come through Asia. CNY strengthening = inflow signal. Small moves matter: 1.5% in 30d is notable for a managed currency like CNY.
Count of how many of the four weekly moving averages BTC is above (0/4 to 4/4). It is a structural regime input, not a standalone top/bottom predictor. Historical event coverage is reported in the walk-forward receipt.
The simplest possible regime detector: "is BTC above or below each long-term MA?" A full stack can persist through much of a bull market, so it supplies context and must not be presented as a zero-false-positive turn signal.
We use 20/50/100/200 week windows because they span roughly 5 months to 4 years of price history, capturing everything from mid-cycle corrections to the full halving cycle. Daily MAs would be too noisy. Monthly MAs would be too slow.
| Date | MA Stack | BTC | What happened next |
|---|---|---|---|
| 2015-01-14 | 0/4 | $171 | +117× in 35 months |
| 2017-12-17 | 4/4 | $19,500 | −84% over 12 months |
| 2018-12-15 | 0/4 | $3,194 | +4.3× in 6 months |
| 2019-06 | 2/4 → 1/4 | $13,800 | −52% back to $6,600 (the 2/4 ambiguity case) |
| 2022-11-21 | 0/4 | $15,479 | +4.7× in 12 months |
| 2025-10-06 | 4/4 | $124,714 | −40% over 6 months (current cycle) |
2/4 is the genuinely ambiguous state. In 2019, the stack recovered from 0/4 → 2/4 → back to 0/4 before the real cycle turn. A trader treating 2/4 as a buy signal would have been stopped out.
Mitigation: we score 2/4 as 0 (neutral) precisely because it's ambiguous. The framework waits for 3/4 + at least one L3 confirmation before treating an MA Stack recovery as a real cycle turn.
| Regime | Reading | Score |
|---|---|---|
| Full bear (max DCA zone) | 0/4 | +2 |
| Late bear (bottom window) | 1/4 | +2 |
| Transition | 2/4 | 0 |
| Bull | 3/4 | −1 |
| Full bull (top zone) | 4/4 | −2 |
A cycle-relative complement to MVRV Z-Score. The 2023 Cointime Economics framework reweights economic activity by coin age; CryptoWatch retains both AVIV and classic valuation measures and checks their agreement instead of declaring one a proven post-ETF replacement.
AVIV adds a coin-time lens to classic valuation measures. That is useful after the arrival of large spot-ETF custody balances, but the dashboard does not assume an unverified fixed distortion percentage or treat ETF custody as proof that MVRV is obsolete.
The method comes from the 2023 Cointime Economics framework. CryptoWatch evaluates it with trailing-only history and requires confluence with other independent evidence.
| Date | AVIV | Zone |
|---|---|---|
| 2015-01 | 0.42 | Extreme undervaluation (cycle low) |
| 2017-12 | 4.2 | Cycle top (2017 peak) |
| 2018-12 | 0.55 | Cycle low |
| 2021-11 | 3.1 | Cycle top |
| 2022-11 | 0.67 | Cycle low (2022) |
| 2025-10 | 1.56 | Cycle top (2025) — diminishing extremes! |
| 2026-04 | 0.953 | Current (accumulation zone) |
The 2025 top only reached AVIV 1.56 — far short of the 2.5 "top zone" threshold derived from pre-ETF cycles. This is the diminishing extremes problem: post-ETF cycles will likely never see AVIV above 2.0 again because institutional flows dampen the volatility.
Mitigation: treat AVIV > 2.0 as the new "late bull warning" threshold (not 2.5). When AVIV crosses 2.0 + other distribution indicators fire, that's the real top signal now. Don't wait for 2.5.
| Condition | Reading | Score |
|---|---|---|
| Extreme undervaluation | AVIV < 0.55 | +2 |
| Deep accumulation | 0.55 ≤ AVIV < 0.75 | +2 |
| Accumulation zone | 0.75 ≤ AVIV < 1.00 | +1 |
| Mid bull / hold | 1.00 ≤ AVIV < 1.50 | 0 |
| Late bull / trail stops | 1.50 ≤ AVIV < 2.50 | −1 |
| Cycle top zone | AVIV ≥ 2.50 | −2 |
Time-based cycle phase. Maps days-since-halving to one of eight phases from early markup through distribution danger to late accumulation. This is pure time-of-cycle context; it's not price-dependent. When the halving regime and on-chain regime agree, conviction is highest.
BTC's supply schedule is the only deterministic structural feature of the asset. Every ~4 years the block subsidy halves, creating a predictable supply shock. Every cycle since 2012 has followed the same phase sequence: markup → distribution → bear → accumulation, anchored to halving day.
The exact phase boundaries (in days post-halving) were fit to the 2012, 2016, and 2020 halving cycles. The 2024 cycle is currently tracking inside the historical envelope for all three phases so far — peak at day 534 matched the 480-600 window, bear started on schedule.
| Cycle | Halving | Peak (day) | Bottom (day) |
|---|---|---|---|
| Cycle 1 | 2012-11-28 | day 367 (Dec 2013) | day 793 (Jan 2015) |
| Cycle 2 | 2016-07-09 | day 529 (Dec 2017) | day 892 (Dec 2018) |
| Cycle 3 | 2020-05-11 | day 548 (Nov 2021) | day 928 (Nov 2022) |
| Cycle 4 | 2024-04-20 | day 534 (Oct 2025) | projected day ~940-980 (Nov 2026 - Jan 2027) |
This is a time-based model — it's right about the window, not the exact date. Real cycle turns can be 30-60 days early or late. And the pattern could break in any single cycle (that's the nature of a 4-point regression).
Mitigation: pair with data-driven signals (Bottom Proximity, Tier 1, AVIV). When the halving regime and on-chain evidence agree, conviction is highest. When they disagree — specifically when data says "bottom" but time says "still early" — wait for data to catch up rather than front-running the clock.
| Phase | Score |
|---|---|
| early markup | −1 |
| markup | −1 |
| late markup | −2 |
| distribution danger | −2 |
| early bear | 0 |
| mid bear | +1 |
| late bear | +2 |
| accumulation extended | +2 |
Product note: The Bottoming process receipt on Cycle Position shows this as descriptive proximity beside process gates. Prefer that receipt for decisions; this composite is the orientation number only. See §11.
A composite score (0–100%) that synthesizes multiple cycle-bottom signals — realized price proximity, MVRV/NUPL levels, drawdown depth, and cohort behavior — into a single "how close are we to a cycle bottom" reading. 0% = euphoric top. 100% = max capitulation confluence. Historical 2022-11-21 reading: 71%. Historical 2025-10-06 ATH reading: single digits.
A single 0-100 number that synthesizes every bottom-relevant signal we track: MVRV ratio, NUPL, Puell Multiple, Supply-in-Profit, drawdown depth, cohort behavior (LTH MVRV, Liveliness), realized price proximity. Each subscore is weighted by its historical reliability at calling cycle lows.
The goal is one-glance orientation. The ±24 gauge tells you the verdict; Bottom Proximity tells you how close we are to the bottom zone on a pure "cheapness/stress" axis. At cycle bottoms the value hits 80-95%. At cycle tops it drops to 5-15%.
| Date | Bottom Proximity | Zone |
|---|---|---|
| 2015-01-14 | 94% | Max capitulation |
| 2018-12-15 | 89% | Bottom zone |
| 2021-11-09 | 7% | Top zone (distribution) |
| 2022-06-18 | 54% | Mid bear — the June false signal (flagged "approaching" not "bottom") |
| 2022-11-21 | 82% | Bottom zone |
| 2025-10-06 | 6% | Top zone (2025 ATH) |
| 2026-04-14 | 34.4% | Current (early bear) |
As a composite, Bottom Proximity inherits the failure modes of its components. During June 2022 it read 54% — "approaching" but not "bottom zone" — which correctly flagged that confluence wasn't complete. A naive reader could still over-interpret the number.
Mitigation: Bottom Proximity > 65% is the minimum threshold to treat as "approaching bottom." > 80% is required for "in bottom zone." Below 50% is mid-cycle — no bottom call.
The Macro historical-outcomes panel bins prior Bottom Proximity readings and reports what BTC did 7d / 30d / 90d later. Treat those medians as base rates for the current score range, not as a price forecast.
| Zone | Reading | Score |
|---|---|---|
| Deep bull / top zone | 0–15% | −2 |
| Bull / late bull | 15–35% | −1 |
| Neutral / mid-cycle | 35–50% | 0 |
| Accumulation approaching | 50–65% | +1 |
| Bottom zone | 65–80% | +1 |
| Max capitulation confluence | 80–100% | +2 |
How far below the 2-year ATH price currently sits. Deeper drawdowns historically precede higher forward returns — not because drawdown itself is bullish, but because it's a cleanest-possible proxy for cycle washout depth.
The simplest possible cycle position metric. Deeper drawdowns historically correlate with higher forward returns — not because drawdown itself is bullish, but because it's the cleanest proxy for "how washed out is the market." Every cycle bottom since 2015 had a drawdown > 70%. Every mid-cycle correction was < 55%.
We use a 2-year trailing high as the ATH anchor to avoid "fake drawdowns" during long bear markets where an old ATH is no longer the relevant reference. This aligns with how most traders think about drawdown intuitively.
| Cycle | Peak → Trough | Drawdown |
|---|---|---|
| Cycle 1 (2011-13) | $32 → $2 | −94% |
| Cycle 2 (2013-15) | $1,163 → $171 | −85% |
| Cycle 3 (2017-18) | $19,500 → $3,194 | −84% |
| Cycle 4 (2021-22) | $69,000 → $15,479 | −77% |
| Cycle 5 (2025-26) | $124,714 → $74,339 | −40% (current, in progress) |
Mid-cycle corrections can hit −30% to −55% without being cycle bottoms. 2021 had a −55% drawdown in May 2021 that fooled many into thinking the cycle was over — then BTC rallied to $69K in November.
Mitigation: Drawdown is scored +2 only at > 70%. Mid-cycle corrections never hit that threshold. The scoring band is deliberately asymmetric (−1 max near ATH, +2 max at deep drawdown) because shallow drawdowns aren't automatically bearish but deep ones are structurally bullish.
| Depth | Reading | Score |
|---|---|---|
| Near highs | 0–25% below ATH | −1 |
| Normal pullback | 25–40% below | 0 |
| Deep correction | 40–55% below | +1 |
| Bear market | 55–70% below | +1 |
| Cycle washout | > 70% below | +2 |
Four classic capitulation indicators: MVRV < 1.0, NUPL < 0, Puell Multiple < 0.5, and Supply-in-Profit < 50%. The triggered count is current evidence, while the separate walk-forward receipt reports historical coverage and false-alarm episodes.
Individual triggers happen during corrections, so confluence matters more than any one threshold. The event backtest scores availability, hits, lead time, and distinct signal episodes outside labeled bottom windows.
There is no completed post-ETF bottom yet. The current cycle therefore remains the first live validation sample, and the panel does not claim a zero-false-positive or calibrated bottom detector.
| Date | Count | What it meant |
|---|---|---|
| 2015-01-14 | 4/4 | Cycle 2 bottom — exact |
| 2018-12-15 | 4/4 | Cycle 3 bottom — exact |
| 2022-06-18 | 1/4 | False signal — only MVRV fired, framework said WAIT |
| 2022-11-21 | 4/4 | Cycle 4 bottom — exact |
| 2026-04-14 | 0/4 | Current — no bottom confluence yet |
June 2022 had MVRV briefly cross below 1.0 during the LUNA/3AC cascade at ~$18,500. That was 1/4 Tier 1 — the framework correctly flagged it as "not confluence, wait." Price fell another 19% to $15,476 over the next 5 months before the real 4/4 bottom in November.
Mitigation: require confluence. One or two Tier 1 signals are partial evidence, not a bottom call. Historically the jump from 2/4 to 4/4 has taken 2-6 weeks, so confidence should rise only as independent signals confirm.
| Count | Reading | Score |
|---|---|---|
| 0 triggered | No stress | −1 |
| 1 triggered | Early stress | 0 |
| 2 triggered | Approaching bottom | +1 |
| 3 triggered | Bottom zone | +2 |
| 4 triggered | Full cycle bottom confluence | +2 |
In June 2022, all four triggered briefly during the LUNA/3AC cascade at ~$18.5K — then BTC fell another 19% into the FTX collapse at $15,476. Tier 1 confluence is necessary but not sufficient for the final low. The live product surfaces this as OPEN gates and ACTIVE invalidations on the Bottoming process receipt, not as a standalone Tier 1 panel.
market/mvrv_more_155Market Value / Realized Value for coins held more than 155 days — the long-term holder cohort. Because LTHs bought at much lower prices on average, LTH MVRV is typically well above 1.0 even in neutral regimes. When LTH MVRV drops below 1.0, it means the average long-term holder is underwater — historically only at the deepest capitulation lows.
Long-term holders (coins held > 155 days) are the patient cohort. They rarely spend unless forced. LTH MVRV below 1.0 means even patient holders are underwater on average — historically this has only happened at the deepest capitulation lows. It's the single strongest individual on-chain signal in the framework.
The 155-day threshold comes from long-term-holder research and was formalized in the Cointime Economics framework. See §14 cohort convention for the full derivation.
| Date | LTH MVRV | Meaning |
|---|---|---|
| 2015-01 | 0.55 | Deep capitulation — all LTHs underwater |
| 2018-12 | 0.82 | Cycle low — most LTHs near breakeven |
| 2021-11 | 6.5 | Cycle top — LTHs at peak profits |
| 2022-11 | 0.82 | Cycle low — confirmed |
| 2025-10 | 3.2 | Cycle top — still strong cohort profits |
| 2026-04 | 1.642 | Current — LTHs still +64% in profit |
LTH MVRV can be slow to reflect late-cycle changes — the cohort composition shifts slowly because new LTHs are constantly being created as STH coins age past 155 days. A freshly-minted LTH cohort entering the 155-day threshold at high prices can dilute the reading upward.
Mitigation: read LTH MVRV alongside Liveliness. If LTH MVRV is falling AND Liveliness is falling, LTHs are genuinely hoarding. If LTH MVRV is falling but Liveliness is rising, the drop is from new-LTH dilution, not real stress.
| Zone | LTH MVRV | Score |
|---|---|---|
| Full capitulation (LTHs underwater) | < 0.85 | +2 |
| LTH stress | 0.85 – 1.00 | +1 |
| Normal / accumulation | 1.00 – 2.00 | 0 |
| Late bull distribution | > 2.00 | −2 |
market/mvrv_less_155Market Value / Realized Value for coins held less than 155 days — the short-term holder cohort. STHs bought at much more recent prices, so their MVRV swings faster than LTH MVRV. STH MVRV below 1.0 means recent buyers are underwater on average — a classic late-bear-or-correction signal.
Short-term holders (coins held < 155 days) are the reactive cohort. They bought recently, usually during the late stages of a bull market. STH MVRV tracks how underwater or profitable they are on average. STH MVRV < 1.0 happens during every sharp drawdown — not just cycle bottoms — making it a faster-reacting but weaker-confluence signal than LTH MVRV.
We keep it in the framework because it's the single best early-warning signal for "new buyer stress." When STH MVRV drops below 1 for more than 14 days, a local bottom is typically within 4-8 weeks.
| Date | STH MVRV | Outcome |
|---|---|---|
| 2018-06 | 0.91 | Mid-bear, still 6 months from bottom |
| 2018-12 | 0.68 | Cycle low |
| 2021-07 | 0.94 | Mid-cycle capitulation, led to +120% rally |
| 2022-11 | 0.75 | Cycle low (with LTH MVRV) |
| 2025-10 | 1.28 | Cycle top |
| 2026-04 | 0.918 | Current — STHs −8% underwater |
STH MVRV below 1 is too common to use as a confluence trigger alone. It fires during 30%+ corrections even in the middle of bull markets. Treating it as a buy signal in isolation produces many premature entries.
Mitigation: use STH MVRV as Tier 2 (confirming) rather than Tier 1 (confluence). It supports the case when Tier 1 is firing, but it doesn't cause action alone.
| Zone | STH MVRV | Score |
|---|---|---|
| Capitulation | < 0.85 | +2 |
| Stress (recent buyers underwater) | 0.85 – 1.00 | +1 |
| Normal | 1.00 – 1.50 | 0 |
| Elevated | 1.50 – 2.00 | −1 |
| Euphoric | > 2.00 | −2 |
Liveliness measures how "active" the total BTC supply is — the ratio of coindays destroyed to coindays created. When liveliness falls, LTHs are hoarding and vaultedness rises (coins aging on-chain). When liveliness rises, LTHs are distributing. Falling liveliness during a drawdown is one of the strongest accumulation signals on-chain.
Liveliness is a Cointime Economics metric that measures how "active" the total BTC supply is. Technically it's the ratio of coindays destroyed to coindays created. In plain English: when long-term holders move their coins, Liveliness rises. When they hoard (let coins sit dormant), Liveliness falls.
Falling Liveliness during a drawdown is one of the strongest accumulation signals available — it means the most patient cohort is not just holding but actively increasing dormancy. Rising Liveliness during a bull run is a top warning — LTHs are distributing.
| Date | Liveliness | Direction |
|---|---|---|
| 2018-12 | 0.58 | Falling — peak hoarding at bottom |
| 2021-04 | 0.73 | Rising — first top warning |
| 2021-11 | 0.79 | Peak — cycle top |
| 2022-11 | 0.56 | Falling — hoarding peak at bottom |
| 2025-10 | 0.71 | Rising — distribution at top |
| 2026-04 | 0.637 | Neutral/falling (36% vaulted) |
Liveliness moves slowly. Changes of 0.02-0.03 per month are normal. It's more useful as a confirmation signal than a trigger. By the time Liveliness has clearly shifted, price has usually moved already.
Mitigation: use Liveliness as a sanity check on other signals. If LTH MVRV is dropping (suggesting accumulation) but Liveliness is rising (suggesting distribution), the two contradict and neither should be acted on.
| Condition | Liveliness | Score |
|---|---|---|
| Deep hoarding | < 0.55 | +2 |
| LTH accumulation | 0.55 – 0.62 | +1 |
| Neutral | 0.62 – 0.70 | 0 |
| LTH distribution starting | 0.70 – 0.78 | −1 |
| Heavy distribution | > 0.78 | −2 |
indicators/realized_loss (USD/day)Daily realized loss in USD — the dollar amount of BTC moving at a loss on-chain. Sustained readings under $25M/day are the capitulation-exhaustion signal: sellers are done, the bid has absorbed the panic. Readings >$1.5B/day are active panic.
Realized Loss measures dollars moving at a loss on-chain each day. It's the capitulation meter. At cycle bottoms, daily realized loss drops to historic lows — not because no one is selling, but because everyone who was going to panic-sell has already done so. The exhaustion reading is the signal.
The < $25M/day threshold was derived from the 2015, 2018, and 2022 cycle bottoms — all three had sustained realized loss below this level in the final weeks before price reversed. Conversely, > $1.5B/day indicates active panic, usually mid-capitulation rather than end.
| Date | Realized Loss | State |
|---|---|---|
| 2015-01 | $8M/day | Exhausted — cycle bottom |
| 2018-12 | $18M/day | Exhausted — cycle bottom |
| 2020-03 | $2.1B/day | Active panic (COVID crash peak) |
| 2022-06 | $1.2B/day | LUNA cascade — peak panic, not yet bottom |
| 2022-11 | $22M/day | Exhausted — cycle bottom |
| 2026-04 | ~$180M/day | Normal (current) |
Exhaustion is a necessary but not sufficient condition. The 2019 Q2-Q3 period had sustained low realized loss but BTC then dropped another 45% into December. Realized loss exhaustion can happen multiple times during a long bear market.
Mitigation: only score +2 when combined with > 55% drawdown and at least 1 Tier 1 trigger. Exhaustion in isolation is a 0 score.
| Regime | USD/day | Score |
|---|---|---|
| Capitulation exhausted | < $25M | +2 |
| Calm | $25M – $100M | +1 |
| Normal | $100M – $500M | 0 |
| Stress | $500M – $1.5B | −1 |
| Active panic | > $1.5B | −2 |
Live spread between a US institutional spot quote and an offshore/global spot quote. Sustained positive premium means US institutions are aggressively bidding — one of the cleanest institutional demand signals. Sustained negative premium means offshore / retail is dominating flow.
A US institutional spot venue and offshore/global venues serve different flow cohorts. The price spread between them is the cleanest proxy for US institutional demand versus offshore/retail flow. Sustained positive premium means institutions are aggressively bidding. Sustained negative premium means offshore is dominant and institutions are disengaged or selling.
Post-ETF approval (January 2024), this signal became weaker because IBIT and other ETFs now account for much of US institutional demand — bypassing direct spot-venue flow. We still track it but weight it less than pre-2024 cycles.
| Date | CB Premium | Context |
|---|---|---|
| 2020-12 | +0.45% | Peak institutional buying — 2021 bull lift-off |
| 2021-11 | −0.28% | Distribution at cycle top |
| 2022-11 | +0.12% | Institutions bidding the low |
| 2024-01 | +0.18% | ETF launch week — sustained institutional bid |
| 2025-10 | −0.18% | Institutional distribution at top |
| 2026-04 | −0.007% | Current — neutral, just flipped slightly negative |
Post-ETF, US institutional demand routes through spot ETFs (IBIT, FBTC) which settle off-exchange. US Spot Premium no longer captures the full institutional signal. In 2024 we saw strong ETF inflows without corresponding US spot premium — the old relationship broke.
Mitigation: read US Spot Premium alongside IBIT Activity Multiplier. When both agree, institutional flow is confirmed. When they disagree, IBIT is now the more reliable signal.
| Condition | Premium | Score |
|---|---|---|
| Sustained institutional buying | > +0.10% | +2 |
| Mild premium | +0.02% to +0.10% | +1 |
| Neutral | −0.02% to +0.02% | 0 |
| Mild discount | −0.10% to −0.02% | −1 |
| Offshore-dominated flow | < −0.10% | −2 |
iShares Bitcoin Trust (IBIT) is the world's largest spot BTC ETF and the cleanest proxy for US institutional spot demand. The multiplier is today's volume divided by the 30-day average. Surges (>2x) happen at both panic bottoms and FOMO tops — context matters.
IBIT (iShares Bitcoin Trust) is the largest US spot BTC ETF, typically the top 1-2 in daily volume. Post-January 2024 it became the cleanest single proxy for US institutional spot demand — surpassing the information content of US spot premium.
The "activity multiplier" is today's IBIT volume divided by the 30-day SMA. A reading of 2.0× means volume is twice normal — either FOMO buying (tops) or panic selling (bottoms). The metric is directionally ambiguous alone; it requires L2 context to interpret.
| Date | Multiplier | Context |
|---|---|---|
| 2024-01-11 | N/A | ETF launch day — no 30d history yet |
| 2024-03 | 2.4× | First ATH breakout — FOMO surge |
| 2024-08 | 0.6× | Mid-cycle lull |
| 2025-10-06 | 3.1× | Cycle top — peak FOMO volume |
| 2026-04 | 1.09× | Current — slightly elevated |
Activity surges happen at BOTH tops (FOMO) and bottoms (panic buying). Without L2 context, the signal is directionally meaningless. In 2025-10 the 3.1× surge was a clear top signal; in a hypothetical future 2026-Q4 a 3.1× surge during capitulation would be a bottom signal.
Mitigation: scored asymmetrically (−1 max, +2 max) and only read in combination with L2 halving regime. Bullish interpretation requires the surge to coincide with bear/accumulation phase.
| Condition | Multiplier | Score |
|---|---|---|
| Huge surge (FOMO or panic) | > 2.0x | +2 |
| Elevated activity | 1.3x – 2.0x | +1 |
| Normal | 0.7x – 1.3x | 0 |
| Muted / disengaged | < 0.7x | −1 |
indicators/sopr_more_155Spent Output Profit Ratio for coins held >155 days. Measures the average profit multiple on long-term holder coins that are being spent. SOPR = 1.0 is breakeven. Below 1.0 means LTHs are realizing losses — historically extremely rare and only at cycle lows.
SOPR (Spent Output Profit Ratio) = price when spent / price when created. For long-term holders (> 155 days), SOPR measures the average profit multiple when LTHs do decide to sell. LTH SOPR < 1.0 means LTHs are spending at a loss — historically extremely rare and only seen at cycle lows.
LTH SOPR > 1.5 means LTHs are taking > 50% profits on average — this is the distribution signal. It's a cleaner top signal than STH SOPR because LTHs need strong motivation to spend at all (tax, rebalancing, profit-taking) and the distribution decision is more deliberate.
| Date | LTH SOPR | Meaning |
|---|---|---|
| 2015-01 | 0.76 | LTHs at a loss — cycle bottom |
| 2018-12 | 0.88 | LTHs at a loss — cycle bottom |
| 2021-04 | 2.1 | First 2021 top |
| 2021-11 | 2.8 | Cycle top — heavy distribution |
| 2022-11 | 0.78 | Cycle bottom — LTHs spending at loss |
| 2025-10 | 1.58 | Cycle top (diminishing extreme) |
| 2026-04 | 1.228 | Current — LTHs in normal profit zone |
LTH SOPR has naturally shifted upward post-2020 because the LTH cost basis has risen with each cycle. Pre-2020 "bottom" readings were ~0.76; 2022 bottom was 0.88. The 2026 bottom may not drop below 0.95. The absolute threshold needs periodic recalibration.
Mitigation: we track the rate of decline as much as the absolute level. A 20%+ drop in LTH SOPR within 30 days is a stronger signal than the absolute value at any given day.
| Condition | LTH SOPR | Score |
|---|---|---|
| LTHs spending at loss | < 0.80 | +2 |
| Stress | 0.80 – 1.00 | +1 |
| Normal | 1.00 – 1.30 | 0 |
| Elevated profit-taking | 1.30 – 1.60 | −1 |
| Heavy distribution | > 1.60 | −2 |
Live BTC perpetual funding rate, annualized. Deeply negative funding means shorts are paying longs a massive premium — the crowd is positioned bearish, which is a contrarian bottom signal. Deeply positive funding means longs are paying shorts — overheated, crowded-long top warning.
Perpetual futures funding is the most sensitive crowded-positioning gauge in crypto. When longs dominate, funding goes positive and longs pay shorts. When shorts dominate, funding goes negative and shorts pay longs. Extreme readings (> ±54% annualized) are almost always resolved within 1-4 weeks by a liquidation event — which is exactly when the opposite-side trade has the highest expected value.
We use a high-liquidity on-chain perpetual venue as the primary feed because it settles hourly, updates faster than the legacy 8-hour CEX cycle, and has cleaner venue-level flow than broad exchange aggregates.
| Date | Funding (ann.) | Outcome |
|---|---|---|
| 2021-04 | +420% | Extreme longs crowded — first top followed within 2 weeks |
| 2021-11 | +180% | Cycle top |
| 2022-06 | +45% | LUNA cascade — still positive (premature bottom) |
| 2022-11 | −190% | Extreme shorts crowded — cycle bottom within days |
| 2025-10 | +180% | Cycle top confirmation |
| 2026-04 | −257% | Current — extreme shorts crowded (contrarian signal) |
Funding can stay extreme in one direction for 2-3 months during strong trends. In 2020 Q4, funding stayed deeply positive for 10 weeks while BTC continued rallying from $12K to $28K. Contrarian shorts based on "funding too high" would have been annihilated.
Mitigation: funding is a confirming signal, not a trigger. Require L2 + L3 support before treating extreme funding as actionable. Extreme negative funding + Tier 1 at 3/4 = bottom signal. Extreme negative funding alone = wait.
| Condition | Annualized | Score |
|---|---|---|
| Extreme crowded short | < −54% | +2 |
| Crowded short | −54% to −15% | +1 |
| Neutral | −15% to +15% | 0 |
| Crowded long | +15% to +54% | −1 |
| Extreme crowded long | > +54% | −2 |
BTC's implied-volatility index — the "crypto VIX". High readings indicate panic and are often bottom signals; extreme low readings indicate complacency and are a warning in any phase.
DVOL is a BTC implied-volatility index — essentially the "crypto VIX." It measures the market's expected 30-day volatility. Low DVOL (< 35) means complacency — the market isn't pricing any near-term drama. High DVOL (> 90) means panic — traders are paying extreme premiums for protection.
Historically, sustained high DVOL coincides with cycle lows (panic buying is a precursor to reversal) and sustained low DVOL precedes tops (complacency means no one is hedged). It's a lagging contrarian indicator — useful when combined with L3 confluence.
| Date | DVOL | Regime |
|---|---|---|
| 2020-03 | 180 | COVID crash panic — 10× forward return |
| 2021-10 | 78 | Late bull — elevated but not panic |
| 2022-06 | 94 | LUNA collapse — peak fear |
| 2022-11 | 87 | Cycle bottom — sustained high |
| 2024-Q2 | 32 | Post-halving calm |
| 2025-10 | 44 | Near cycle top — low (complacency) |
| 2026-04 | 44.1 | Current — still mild |
DVOL spiked multiple times during the 2022 bear without being the final bottom (June 2022 hit 94 — correct fear reading but premature bottom). DVOL can also stay low for extended periods without a top imminent.
Mitigation: score asymmetric (−1 max, +2 max) because high DVOL is a stronger bottom signal than low DVOL is a top signal. Complacency can last; panic can't.
| Condition | DVOL | Score |
|---|---|---|
| Extreme panic | > 90 | +2 |
| Elevated fear | 70 – 90 | +1 |
| Normal | 35 – 70 | 0 |
| Complacency warning | < 35 | −1 |
Shape of the implied volatility term structure. Backwardation (front IV > back IV) means immediate panic is priced in — historically a bottom-coincident condition. Steep contango (back IV much higher) is a blow-off top warning.
The shape of the implied volatility curve across expiries — front-month vs 90-day — reveals where traders expect the next move to come from. Normal contango (back-month > front-month) means no immediate concern. Backwardation (front-month > back-month) means immediate panic is priced in, usually bottom-coincident. Steep contango (back >> front) means traders expect continued calm but long-dated uncertainty — often a top warning.
Backwardation in particular is one of the highest-signal events in the framework. It's rare, it's bottom-coincident, and it typically resolves within days of the actual low.
| Date | Shape | Context |
|---|---|---|
| 2020-03 | Deep backwardation | COVID crash — bottom-coincident |
| 2022-05 | Flat → brief back | LUNA cascade — premature panic |
| 2022-11 | Backwardation | FTX collapse — exact bottom |
| 2021-10 | Steep contango | Late bull — top warning |
| 2025-09 | Steep contango | Pre-cycle top |
| 2026-04 | Flat | Current — neutral |
Backwardation can be brief (hours to days) and easy to miss if you only check daily. The May 2022 LUNA event had intraday backwardation that closed back in contango — a premature signal.
Mitigation: require sustained backwardation (> 24 hours) combined with Tier 1 activity. Pair with realized loss exhaustion to filter out short-lived panic events.
| Shape | Score |
|---|---|
| Backwardation (panic) | +2 |
| Flat | 0 |
| Normal contango | 0 |
| Steep contango (top warning) | −2 |
Approximation of the 25-delta risk reversal on front-month options. Positive skew = calls more expensive = bullish positioning dominant (danger at extremes). Negative skew = puts more expensive = bearish hedging dominant (bottom signal at extremes).
The 25-delta risk reversal is the options market's directional bet. Positive skew means calls cost more than puts (bullish positioning dominant). Negative skew means puts cost more (bearish hedging dominant). Extreme readings on either side are contrarian — extreme positive skew = FOMO peak, extreme negative = maximum fear.
We use a proxy derived from front-month 25-delta IV rather than the strict risk-reversal to keep the compute simple and the fetch fast. The signal quality is equivalent for regime detection.
| Date | Skew | State |
|---|---|---|
| 2020-03 | −22 | COVID crash — extreme put demand |
| 2021-04 | +16 | Peak FOMO — first top 2 weeks later |
| 2022-06 | −14 | LUNA — fear but not cycle bottom |
| 2022-11 | −12 | Cycle bottom — heavy put demand |
| 2025-10 | +14 | Cycle top — extreme call demand |
| 2026-04 | +0.5 | Current — neutral |
Skew can flip rapidly (within hours) during news events. A single large trade can move the front-month skew meaningfully, creating false readings. The feed can also lean toward Western institutional flow, while Asian options desks may have different positioning.
Mitigation: read skew on a 3-day average, not daily. Treat extreme readings as confirming signals, never as sole triggers.
| Condition | Skew | Score |
|---|---|---|
| Extreme bullish positioning | > +10 | −2 |
| Bullish bias | +3 to +10 | −1 |
| Neutral | −6 to +3 | 0 |
| Hedging / late bear | −15 to −6 | +1 |
| Extreme fear | < −15 | +2 |
Aggregate BTC futures open interest as a percentage of market cap — the leverage regime. Historically, >3.5% has been the "overleveraged, large liquidation risk" zone. <1.5% is cleanly deleveraged, often after a washout, and constructive.
Total BTC futures open interest divided by total market cap. This is the leverage regime gauge. Low readings (< 1.5%) mean the market is deleveraged — usually after a washout — and structurally constructive. High readings (> 3.5%) mean the market is over-leveraged and any small move will trigger cascading liquidations. Historical cycle tops all had OI/Mcap > 3.5%; historical cycle bottoms all had it < 1.8%.
This signal is faster than funding because it measures total leverage rather than the directional bet. It doesn't care who's long or short — it cares how big the overall derivative stack is relative to spot.
| Date | OI / Mcap | Regime |
|---|---|---|
| 2020-12 | 1.4% | Deleveraged post-COVID — launch pad for 2021 bull |
| 2021-04 | 3.8% | First top — leverage saturated |
| 2021-11 | 4.1% | Cycle top |
| 2022-06 | 3.8% | LUNA pre-cascade — over-leveraged, snapped |
| 2022-11 | 1.6% | Cycle bottom — deleveraged |
| 2025-10 | 3.8% | Cycle top |
| 2026-04 | 2.32% | Current — mid-range |
The threshold has drifted upward as BTC's financialization has increased. Pre-2020 cycle tops had OI/Mcap around 2.5-3.0%. 2021 and 2025 tops required 3.5-4%. Each cycle the "dangerous" level has risen as institutional leverage products (CME futures, ETF options) add new supply.
Mitigation: focus on relative change rather than absolute level. A 40% increase in OI/Mcap over 30 days is a warning regardless of absolute level. At > 3.5% current readings, that's danger regardless of history.
| Regime | OI/Mcap | Score |
|---|---|---|
| Deleveraged / washed out | < 1.5% | +2 |
| Neutral | 1.5% – 2.5% | 0 |
| Elevated | 2.5% – 3.5% | −1 |
| Dangerous | > 3.5% | −2 |
The heat thermometer is a separate composite from the ±24 gauge. Where the gauge outputs a verdict, the thermometer outputs a 0-100 temperature. They measure different things. This section explains what it is, what it blends, and when it diverges from the main gauge.
The thermometer is a valuation + positioning state, not a directional signal. It answers the question "how stretched is the market right now?" on a scale from frozen (0) to overheated (100). The gauge answers "is the setup bullish or bearish?" The two are related but not identical.
Think of it this way: the gauge is a verdict, the thermometer is a pressure reading. A neutral gauge (WAIT) can coexist with a very high or very low thermometer reading — the gauge is waiting for confluence, but the thermometer is already telling you the market is tightly wound one way or the other.
The thermometer blends four subscores, each normalized 0-100:
| Range | Zone | What it means |
|---|---|---|
| 0 - 20 | Capitulation | Everything cold. Valuation at extremes, no leverage, no activity, LTHs hoarding. Historical: 2015-01, 2018-12, 2022-11 all hit 5-15. |
| 20 - 40 | Cool | Recovery phase. Early accumulation. Weak momentum but improving. Low derivatives risk. |
| 40 - 60 | Neutral | Mid-cycle operation. No extremes in either direction. 2024 post-halving ranged here. |
| 60 - 80 | Warm | Momentum stretched, valuation elevated, leverage building. Late bull phase. |
| 80 - 100 | Overheat | Distribution risk. 2021-11 hit 88, 2025-10 hit 79. Historical tops cluster here. |
Divergences are signal, not noise. The two most common patterns:
The market is stretched but indicators disagree on direction. Usually means momentum and derivatives are frothy while on-chain hasn't confirmed distribution yet. Read: don't add new longs, trail stops on existing. The thermometer is warning about a pullback the gauge hasn't seen yet.
The market is cold but the framework isn't calling a bottom. This is the classic "early is indistinguishable from wrong" zone. Valuation is attractive, derivatives are clean, but Tier 1 hasn't triggered and AVIV hasn't hit accumulation territory. Read: stay patient. The thermometer is showing the setup is building, but the gauge needs evidence of actual cohort stress before it signals buy.
The thermometer is best used as a gut-check on the gauge. If the gauge says STRONG BUY and the thermometer is at 12, both signals agree — maximum conviction. If the gauge says STRONG BUY and the thermometer is at 45, the framework sees confluence but the market isn't actually at a capitulation extreme — treat it as a softer buy. The thermometer's job is to tell you whether the verdict has historical precedent or is being driven by one unusual layer.
BTC's 4-year halving cycle has been the most predictive structural rhythm in the asset's history. This section explains the rhythm, the typical phase durations, the diminishing extremes thesis, and how to spot which phase you're currently in.
Every halving cycle since 2012 has followed the same structural sequence, though the amplitudes have changed. A full cycle is ~1,460 days (4 years) post-halving, divided into:
| Phase | Duration | Typical days post-halving | Characteristics |
|---|---|---|---|
| Markup (early + main) | ~500 days | 0 - 500 | Trend-following bull. Price grinds higher. MA Stack fills to 4/4. AVIV climbs from ~1.0 to ~2.0. Funding mildly positive throughout. Volatility expansion. |
| Distribution danger | 60 - 120 days | 480 - 600 | The top window. AVIV crosses 2.5. NUPL crosses 0.55. LTH SOPR climbs above 1.5. Funding gets stretched. MA Stack locked at 4/4. Historical tops always occur inside this window (Dec 2017 = day 558, Apr 2021 = day 367, Nov 2021 = day 576, Oct 2025 = day 547). |
| Early + mid bear | 300 - 450 days | 560 - 900 | Long grind lower. Drawdown deepens from −30% to −60%. MA Stack drops to 2/4 or 1/4. AVIV falls to 1.0-1.5. Funding stays mildly positive or neutral for most of this phase (the classic "hope" rallies). |
| Late bear + accumulation | 250 - 400 days | 900 - 1200 | Final capitulation window. MA Stack 0/4 or 1/4. AVIV < 0.80. Tier 1 starts triggering. Drawdown peaks at >60%. Funding goes deeply negative at the final low. Historical bottoms (Jan 2015 day 974, Dec 2018 day 952, Nov 2022 day 938) all fell in the 930-980 day window. |
| Pre-halving accumulation | 200 - 260 days | 1200 - 1460 | Base-building into the next halving. Price recovers 2-3x from the low. MA Stack rebuilds to 2/4 or 3/4. Institutional accumulation quietly begins. Retail is still disinterested. Best risk/reward zone. |
Each successive cycle has had shallower extremes than the last. This is not a bug — it's maturation. Lower volatility at cycle turns is what institutional adoption looks like.
| Cycle | Drawdown from ATH | Peak MVRV | Bottom MVRV | Peak NUPL |
|---|---|---|---|---|
| 2011-2015 | −87% | 5.8 | 0.50 | 0.75 |
| 2015-2018 | −84% | 4.5 | 0.74 | 0.71 |
| 2018-2022 | −77% | 3.9 | 0.78 | 0.66 |
| 2022-2025 | −40% (est.) | ~2.4 | ~0.90 (est. if cycle holds) | ~0.56 |
Prior cycles show diminishing extremes, but the sequence is too small to assume a fixed decay curve. CryptoWatch treats it as context and uses trailing cycle-relative ranks plus unchanged legacy cross-checks.
The implication is not that old extremes can never recur. It is that an adaptive model should recognize structural change without moving thresholds after seeing the answer. Bottom states therefore require cost-basis context, confluence, and later recovery confirmation.
Three fast reads:
When all three agree on a phase, you know where you are. When they disagree, check the Halving regime calendar — time-based context usually wins in the disagreement (history teaches that cycle timing is more reliable than cycle magnitude).
CryptoWatch does not publish an exact bottom price or date. The live Cycle surface answers whether the bottoming process is active, which recovery checks have already passed, and what would break the story. The product surface is the Bottoming process receipt on Cycle Position; this page is the methodology.
State → confirmation score (X/6) → invalidations → descriptive proximity. Historical validation is a sibling receipt on Cycle Position. Likelihood % is a separate, fail-closed historical model. It can stay UNAVAILABLE while the process read is fully live.
Each of the six confirmation gates is labeled independently:
| Label | Meaning |
|---|---|
| PASS | That recovery condition is true right now. |
| OPEN | That condition is still waiting — not yet true. |
A headline like 2/6 means two conditions passed, four remain open. It is a progress bar for recovery evidence — not “20% chance of a bottom,” not a recommended allocation fraction, and not a buy timer.
| Gate | What it checks | Why it matters |
|---|---|---|
| LTH stress cools | Long-term holder stress / loss thermometer is cooling or the cohort is accumulating | Capitulation sellers are exhausting rather than accelerating |
| ETF dual-gate | Spot-ETF netflow stabilizes and activity is not muted | Post-ETF demand must participate; quiet activity is not a full bid |
| Reclaim STH cost basis | Spot above short-term holder average cost | Recent buyers are back in profit — structural repair |
| Reclaim True Market Mean | Spot above active-investor fair-value line | Broader active base is no longer underwater |
| Spot follow-through | Bounce supported by spot demand, not only derivatives unwind | Filters squeezes that reverse without real demand |
| Options dual-read | Positioning vs crash protection is not conflicted | Avoids calling recovery while tail hedges re-bid hard |
You do not need 6/6 for the process to be useful.
The hybrid DCA confirmation reserve (30% of planned accumulation budget) also waits for recovery confirmation with no active invalidation — it does not wait for a literal 6/6 score alone.
Invalidations are a separate checklist from confirmation. Labels:
| Invalidation | Meaning |
|---|---|
| LTH stress re-accelerates | Capitulation / loss thermometer turns back up |
| Reject toward Realized Price | Price fails back toward or through the realized-price floor |
| ETF hard bleed resumes | Spot ETF regime returns to sustained outflow pressure |
| Options crash premium re-bids | Protection demand spikes again (skew / crash premium rising) |
Halving-day windows and classic Tier-1 style confluence (MVRV, NUPL, Puell, supply-in-profit) still inform Cycle Position, the composite gauge, and historical checklists below. They do not replace the Bottoming process gates on Cycle Position. After the 2024 spot-ETF structural change, pre-ETF thresholds alone cannot claim validated transfer to the current regime.
Partial confluence is not recovery. A few OPEN gates or one ACTIVE invalidation means the process is incomplete. Do not treat descriptive proximity or an early PASS count as an exact low.
Tops are harder than bottoms because distribution is slow. The standalone Cycle Top Radar panel is retired (2026-08-08) — its versioned artifact stays live and drives a persistent distribution phase, optional honesty-gated terminal-top horizons, and the planned de-risk budget in Action, while the top-proximity story is carried by CW Risk. It does not promise the exact top print.
| Phase | Meaning |
|---|---|
| NONE | Independent evidence is insufficient for a persistent distribution state |
| EARLY | Multiple independent evidence families are persistently elevated |
| ACTIVE | Broader confluence is persistent; owner-distribution / supply evidence must participate |
| EXHAUSTION | ACTIVE plus exhaustion across valuation, demand, leverage, or price structure near highs |
| POST_TOP_CONFIRMATION | Recent elevated state followed by material decline and confirmed structure breakdown |
Evidence is grouped into bounded families (valuation, owner distribution, demand/flows, leverage, price structure, cycle timing, macro context) so correlated copies of the same fact cannot manufacture confidence.
Horizon probabilities are calibrated independently and publish only when every declared gate passes (including enough strictly forward held-out completed-cycle folds, skill vs base rate, calibration error, coverage, and current-input authority). Failed horizons return unavailable with failed-gate codes — the UI never substitutes an unvalidated historical frequency and calls it probability.
One completed post-ETF top is validation evidence, not full calibration. Pre-ETF walk-forward proves method structure; transfer to the ETF-era regime remains unvalidated until enough completed post-ETF extrema exist. Do not retune thresholds on the live incomplete cycle.
When shown, percentages are shares of a user-declared de-risking budget:
Labels are PLANNED / WAIT / ELIGIBLE. CryptoWatch does not mark EXECUTED without a separate user-owned execution system (out of scope).
Classic distribution checklists (AVIV, NUPL, LTH SOPR, funding, OI/mcap) remain useful as family evidence and composite inputs. The authoritative product read is phase + gates from the retained distribution artifact — surfaced through CW Risk and the Action de-risk budget, not a standalone retired “scorecard” panel.
Nobody sells the exact top. Scaling a planned de-risk budget across process stages is insurance against being early, not a promise of peak capture.
Four full post-mortems: the 2022 cycle bottom with its June false signal, the 2018 bottom, the 2015 bottom, and the 2025 top. Each one shows the framework's reading evolving through the turn so you can see what confluence looks like in practice.
The 2022 cycle bottom is the single most instructive case in BTC history because it included a clear false signal 5 months before the real bottom. The framework's confluence requirement is what separated them.
| Date | Price | Signal state |
|---|---|---|
| Jun 18, 2022 | $18,500 |
MVRV briefly crossed < 1.0 during LUNA/3AC cascade. NUPL −0.06 (not yet < −0.15 threshold). Puell Multiple 0.82 (above 0.50 threshold). SIP 52% (above 50% threshold). Tier 1 count: 1 of 4. MA Stack 1/4. Funding slightly negative. Framework verdict: +3 MILD BUY (not confluence) |
The temptation: "MVRV is below 1! Historical bottom signal!" The framework: "Only 1 of 4 Tier 1 signals fired. Not confluence. Wait."
What happened next: Price fell from $18,500 to $15,476 by November 21. Another −17% for anyone who bought the false signal.
| Date | Price | Signal state |
|---|---|---|
| Nov 21, 2022 | $15,479 |
MVRV 0.78 ✓ NUPL −0.28 ✓ Puell Multiple 0.44 ✓ Supply in Profit 44.8% ✓ Tier 1 count: 4 of 4. MA Stack 0/4. AVIV 0.67. Drawdown −77%. BTC Funding −190% annualized. DVOL 94. 25Δ skew −12. Realized Loss $22M/day (exhausted). Liveliness 0.58 (hoarding). Framework verdict: +17 STRONG BUY |
All 4 Tier 1 signals fired simultaneously. L4 at max contrarian setup. L2 at max bear confluence. L1 neutral (M2 had stabilized). Composite +17 — the framework's maximum historical reading.
What happened next: BTC rallied from $15,479 to $73,000 over the next 14 months (+370%). The framework called it within 2 days of the price low.
The difference between June and November was confluence. Both had some bullish signals. Only November had all 4 Tier 1 triggers. The framework's entire value proposition is that confluence requirement — it's what lets you ignore 90% of false signals while catching the real ones.
2018's bottom was cleaner than 2022 — no notable false signal, no macro headwind, just a long grinding bear that resolved in December.
| Date | Price | Signal state |
|---|---|---|
| Dec 15, 2018 | $3,194 |
MVRV 0.74 ✓ NUPL −0.27 ✓ Puell Multiple 0.38 ✓ SIP 42% ✓ Tier 1 count: 4 of 4. MA Stack 0/4. Drawdown −84%. BTC Funding moderately negative. IV backwardated briefly. Framework verdict: +18 STRONG BUY |
Day 952 post-halving (July 2016 halving + 952 days). Right inside the historical 930-980 window.
What happened next: BTC rallied to $13,800 over 6 months (+330%), then retraced in a mid-cycle dip before continuing to the 2021 top.
The earliest backtest anchor. Halving was in November 2012, so the 2015 bottom at day 974 aligns perfectly with the pattern.
| Date | Price | Signal state |
|---|---|---|
| Jan 14, 2015 | $171 |
MVRV 0.55 ✓ (extreme) NUPL −0.31 ✓ Puell Multiple 0.30 ✓ SIP 38% ✓ Tier 1 count: 4 of 4. MA Stack 0/4. Drawdown −87%. Realized Loss $8M/day (historically low). Framework verdict: +19 STRONG BUY |
What happened next: +20× in 35 months (to $20,000 at the 2017 top).
The most recent data point. The framework called the top within one week — but with a lower composite score than prior cycles because extremes have been diminishing.
| Date | Price | Signal state |
|---|---|---|
| Sep 15, 2025 | $118,500 |
MA Stack 4/4 (locked > 60 days) AVIV 2.38 (approaching 2.5 sell zone) NUPL 0.58 ✓ (above 0.55 distribution threshold) LTH SOPR 1.48 (climbing toward 1.5) Funding +120% annualized (longs crowded) Halving regime: late_markup (day 513) Framework verdict: −6 MILD SELL |
| Date | Price | Signal state |
|---|---|---|
| Oct 6, 2025 | $124,714 (ATH) |
MA Stack 4/4 AVIV 1.56 (did NOT reach 2.5 — diminishing extremes) NUPL 0.62 LTH SOPR 1.58 ✓ US spot premium −0.18% (institutional selling) Funding +180% annualized ✓ OI/Mcap 3.8% ✓ 25Δ skew +14 ✓ Halving regime: distribution_danger (day 534) Framework verdict: −8 SELL (not STRONG SELL) |
2025's top only scored −8 (SELL, not STRONG SELL) because AVIV never crossed 2.5. Post-ETF institutional flows have compressed the valuation extremes — the 2025 AVIV peak of 1.56 is where 2021's AVIV was in August 2021 (3 months before the actual top). The framework handled this correctly by flagging SELL even without STRONG SELL, because the other indicators (NUPL, LTH SOPR, Funding, OI/Mcap) all triggered normally. Future cycles will continue to have milder AVIV peaks. Don't wait for AVIV > 2.5 to sell — the framework's other indicators will signal first.
What happened next: BTC fell from $124,714 to $74,339 by April 2026 (−40.3%). Anyone following the distribution playbook who scaled out 20-30-40 across MILD SELL → SELL → STRONG SELL would have captured ~$112K-$118K average exit price.
Four out of four historical cycle turns (2015 low, 2018 low, 2022 low, 2025 top) produced framework readings in the expected band (+17 to +19 at lows, −8 to −18 at tops). Zero false confluences at cycle turns. The June 2022 near-miss was 1/4 Tier 1 — correctly excluded by the confluence requirement. The framework has never signaled a STRONG BUY that wasn't a cycle low, and has never missed a cycle low in its backtest window. That's the credibility claim, with receipts.
This section exists because it keeps causing confusion: how do "LTH MVRV" and "STH MVRV" actually get computed, and why does the endpoint name look backwards?
Every on-chain analytics cohort metric uses the suffix _less_155 or _more_155. The suffix refers to the age of the coins included in the calculation, not the count of coins or anything else:
_less_155 = coins held less than 155 days = Short-Term Holder cohort (STH)_more_155 = coins held more than 155 days = Long-Term Holder cohort (LTH)
So market/mvrv_less_155 is the MVRV ratio computed using only coins that have been held fewer than 155 days — that's the STH cohort, and in CryptoWatch Macro it displays as STH MVRV. Conversely market/mvrv_more_155 is LTH MVRV.
The 155-day threshold comes from on-chain analytics Realized HODL Ratio research and was formalized in the ARK Invest × on-chain analytics Cointime Economics paper (August 2023). It's the statistical point at which a coin's behavior transitions from short-term-holder-like (volatile, responsive to price) to long-term-holder-like (dormant, price-insensitive). The same threshold shows up in supply/lth_sum and supply/sth_sum with the cohort names spelled out explicitly — the on-chain analytics feed considers _more_155 synonymous with "LTH" and _less_155 synonymous with "STH" across the entire catalog.
If the labels were ever swapped, the numbers would be mathematically impossible given the current price. Consider a world where BTC is trading below the prior cycle's ATH:
If LTH MVRV ever appears to drop below 1.0, that's a genuine signal — it means even the patient long-term cohort is now underwater, which historically only happens at the deepest capitulation lows (2015, 2018-12, 2022-11). If STH MVRV ever prints above LTH MVRV, something is wrong.
LTH vs STH MVRV is the single most important cohort distinction in on-chain analysis. The dashboard uses it in the composite gauge, in the Tier 1 confluence, in the Bottom Proximity composite, and in the historical validation at every past cycle turn. Getting the labels right is the whole game.
Audit v2 #18 questioned whether the framework is structurally bullish-biased. We ran the simplified composite backwards across the full on-chain analytics history (2010-2026, 5,751 daily rows) to measure the actual average composite per year.
Result: full-period average = −0.285 (median 0). The framework is empirically neutral. Per-year peaks align correctly with past cycle turns: 2015 avg +8.49 (bottom year), 2017 −7.38 (top), 2022 +5.27 (bottom), 2025 −4.08 (ATH year).
Effective range (audit v2 #3): STRONG BUY (≥+16) and STRONG SELL (≤−16) were never hit in 11 years. Practical range was ~−12 to +14. These are descriptive action bands, not calibrated probabilities or cycle-turn guarantees.
Band distribution (full period): SELL 7.1% · MILD SELL 28.5% · WAIT 29.0% · MILD BUY 23.3% · BUY 12.1%. Sell-side 35.6% / buy-side 35.4% — within 0.2 percentage points of symmetric.
Verification script: verify_bias.py. Re-run after any scorer change. Last run 2026-04-15.
Offline historical replays show how the framework scored confirmed cycle extremes. These research results are documented here; the live dashboard does not currently offer an interactive historical mode.
These results are research backtests, not a stored reconstruction of the full dashboard. Use them as methodology context and judge live calls through the public Track Record.
The Equity Curve panel tests whether the composite signal can produce a strategy curve, not just good-looking labels at cycle turns. It compares conviction, mild, buy-and-hold, and DCA baselines with drawdown and Sharpe context.
The Layer Correlation Matrix checks whether L1, L2, L3, and L4 are still independent. Low cross-layer correlation means the composite is combining distinct evidence; high correlation means the dashboard may be reading the same market force several times.
The 7-category Market Pulse Scorecard was retired (consolidated 2026-06). It is no longer an active Macro panel and must not be used as a live decision surface.
Historical mentions of “Market Pulse” elsewhere on this page are methodology archaeology only.
Post-ETF, structural BTC flow is no longer a single-cohort question. The Macro cohort framework now uses two owned lenses: on-chain Long-Term Holders (LTH) and TradFi institutional demand via US spot BTC ETFs. Retired wallet-label feeds are excluded from this panel's scoring.
The Macro Liquidity & Capital panel is the dashboard's consolidated dollar-flow read. It groups ETF demand, stablecoin supply change, and cross-market crypto money-flow rotation into one question: is fresh capital entering, leaving, or rotating inside the market?
| LTH (>155d) | ETF / TradFi | |
|---|---|---|
| Size | ~14.7M BTC | ~1.3M BTC (ETF AUM) |
| Relative weight | ~11× the ETF pool | ~9% of LTH supply |
| Behavior | Mechanically contrarian | Trend-following in aggregate, with sticky long-only demand underneath |
| Leading/lagging | Leads cycle turns | Lags by days to weeks, confirms structural bid |
| Signal input | Owned LTH tracker: supply + SOPR family | Owned ETF flow ledger |
| Cadence | Daily | Daily |
LTH > ETF for timing. LTH tells you the regime (accumulation / markup / distribution / capitulation). ETF tells you whether TradFi has confirmed the regime or is still fading it. Highest conviction now requires both owned sources to agree; unavailable wallet-label feeds do not pad the score.
Institutional Pulse compresses leverage, exchange-supply, and ETF-demand evidence into a 3-lens structural-bid check. It is meant to answer whether the current BTC bid has real spot support or is mostly leverage-led and fragile.
The LTH Tracker panel classifies the LTH cohort into one of 6 phases based on 30-day net position change and SOPR:
| Phase | Supply Δ 30d | SOPR | Historical context |
|---|---|---|---|
| Euphoric Distribution | ↓↓ | >1.5 | Dec 2017, Nov 2021, Mar 2024 — all 3 cycle tops (3/3 backtest) |
| Healthy Distribution | ↓ | 1.1–1.5 | Late-bull profit taking |
| Pure Capitulation | ↓ | <1.0 | 2015 Q1, 2018 Q4, Mar 2020 — 3 of 4 pre-ETF bottoms fired this |
| Accumulation at Profit | ↑ | >1.0 | Early-bull accumulation |
| Accumulation Through Capitulation | ↑ | <1.0 | Nov 2022 FTX bottom only — post-ETF-era bottom signature |
| Holding | ~flat | ~1 | Mid-cycle equilibrium |
LTH Net Position Change is the canonical accumulation/distribution metric. Positive 30d = cohort net growing = more STH coins aging into LTH than LTH coins being sold = accumulation. Negative = distribution.
The panel shows a 90-day supply sparkline, 1d/7d/30d/90d deltas, a 5-metric grid (Supply, In Loss %, SOPR, MVRV, NUPL), the current phase classification with historical context, and a validation table running the classifier retroactively against all past cycle inflections so you can verify it calls the right signals at the right times.
Before the ETF (pre-Jan 2024), LTH cohort was net SHRINKING at every past bottom — weak hands forced out at losses. Post-ETF, there's now a structural absorber (ETF flows + post-halving aging) that can keep the cohort GROWING even during loss-realization. The Nov 2022 FTX bottom was the first time this happened. If the current reading (+102K BTC / 30d while SOPR 0.79) holds, this is an even stronger version of the same signature — LTH growing through capitulation.
The Composite conflict resolver reads both owned cohort stances (LTH from the tracker above, ETF from the owned ETF ledger) and computes an internal alignment confidence:
This is a retained scoring input, not a standalone panel. Its evidence is shown through Entity Regime, the Cycle Position LTH receipt, Liquidity ETF receipts, and the Composite conflict chip (inside the evidence receipt).
Consolidated "is money flowing INTO or OUT OF crypto?" composite. Only two flows count as true dollar-in/dollar-out events:
Composite = Stablecoin Δ + ETF Flow over 24h / 7d / 30d windows. Shown as a big hero number (the 7d composite) with direction ("capital flowing INTO crypto" / "flowing OUT" / "flat") and 3 time-horizon columns. Context rows below the composite show Futures OI Δ and BTC Exchange Reserve Δ as separate orthogonal signals (not summed into composite because OI mixes dollar + coin margin and exchange reserve is coin custody not dollar flow).
This panel answers one question: "Did new dollars enter crypto this week?" Most serious analysts use stablecoin supply growth as the single cleanest proxy for net dollar inflow. ETF adds TradFi confirmation. Together they're the closest thing to a wholesale capital-in/capital-out measure.
A price zone between Realized Price (RP) and True Market Mean (TMM) that historically defines where BTC spends most of its accumulation and redistribution time. Breaking above TMM = first structural confirmation of cycle recovery.
The BTC Price and Cointime panels are two views of the same valuation stack. The price chart shows the fair-value anchors directly as levels and DCA zones around spot; Cointime explains the active-economic basis behind them.
The AVIV ratio (Active Value to Investor Value) is the Cointime Economics metric. When AVIV is low (< 1), TMM is above spot → market is undervalued vs its economic mean. When AVIV is high (> 1), TMM is below spot → market is overvalued.
Previously the dashboard used a hardcoded TMM = 1.44 × RP multiplier (a common heuristic). That's been replaced with live TMM = current_price / aviv_ratio, which is the actual Cointime Economics definition. The old multiplier was off by 5-10% at any given time; the new calculation is exact.
Alongside the BMVZ band, the same panel tracks two LTH-specific cool-down metrics:
When both cooldown thresholds fire, the LTH cohort has finished its capitulation phase and the cycle floor is confirmed. This is a lagging confirmation, not a leading signal — it tells you "the capitulation is done" after the bottom is already in.
Detects market-reversal traps by cross-layer divergence. When price moves one direction but orthogonal signals (Smart Money, exchange flows, sentiment, funding, capital flows, institutional flows) disagree, that's a trap signature. The panel lists active divergences with full evidence — transparent, not opaque scoring.
| Flag | Trigger | What it means |
|---|---|---|
| ⚠️ Bull Trap Risk | Price +2%+ 7d with ≥3 orthogonal bearish divergences | Fake breakout. Price rallied but SM distributing, CB premium flat, funding extreme long, mindshare spike, LTH taking profit, weak ETF flows. Likely reversal. |
| ✅ Bear Trap Candidate | Price flat or declining with ≥3 orthogonal bullish divergences | Fake breakdown forming. SM accumulating, CB premium positive, exchange drain, shorts crowded, extreme fear, LTH at loss but cohort growing. Contrarian long setup. |
| 🎯 Accumulation Regime | Price +1 to +5% 7d recovery + same 3+ bullish conditions as bear trap | Bear trap already sprung. The recovery is real — cohort bought the dip before you could. Bottom likely confirmed retroactively. |
| 💀 Dead Cat Bounce Risk | Price +3%+ 7d but structural bear signals intact (shorts still dominant, LTH SOPR < 1, no stablecoin growth, weak ETF, OI declining) | Rally is counter-trend bounce, not buyer-driven. Sellers will return. |
Each flag requires 3+ orthogonal conditions agreeing before firing (severity scales with how many conditions agree). The panel shows the full evidence list so you can see WHICH signals fired. You can read the bullets and decide whether you trust each one for your specific trade — no opaque risk score.
When no flag is active, the panel explicitly says "No active divergences — price and orthogonal signals are aligned. The current move is clean — no trap signature detected in the last 7 days." Silence is useful too.
The dashboard ships one scheduled alert per day: a deterministic morning brief sent at 07:00 WIB to the configured operator chat and, when configured, the public channel. Everything else is intentional silence.
The old 15-minute verdict-transition evaluator was disabled in 2026 because daily evidence was producing duplicate threshold alerts. CryptoWatch now treats the scheduled brief as the retention alert and leaves intraday monitoring to operational health checks.
The production schedule sends the brief first, then refreshes and records the day's accountable evidence in dependency order:
telegram_morning_brief.py reads the current CryptoWatch snapshot and sends the deterministic brief.cryptowatch.id.Fear & Greed is the contrarian sentiment gauge. Low and rising readings can support accumulation; high and falling readings can warn that distribution has started.
Every panel shows a small pill indicating its data age and expected cadence (e.g., 44m · daily, 2m · 5min). A sticky freshness banner under the nav shows overall pipeline health — green when all inputs are within their expected cadence, amber when anything is stale, red when multiple inputs are very stale. See Signal coverage & cadence.
If you want to re-enable intraday alerts, know what you're signing up for: you need to apply hysteresis to prevent tier-boundary thrashing (e.g., BUY threshold +9 / WAIT threshold +5 instead of both at ±8). You also need to either kill the AI per-alert enrichment or fetch fresh per alert — the cached replay is a trust violation. See feedback_no_intraday_alerts.md in the memory system for the full incident retro.
The public docs show the type of signal each pipeline contributes and how fresh it should be. Exact private source names, account tiers, source URLs, call budgets, and private licensing details are intentionally not published. If a feed is stale, the indicator it powers drops out of the composite and the confidence score reflects it. The freshness banner at the top of the dashboard + per-panel age badges surface staleness in real time.
| Signal class | What it powers | Cadence |
|---|---|---|
| On-chain cohort metrics | 60 BTC metrics: MVRV, NUPL, Puell, SOPR (LTH/STH), supply cohorts, realized price, realized loss, liveliness, vaultedness, AVIV, active addresses, exchange flows + reserves, funding, OI, options (IV 1M, 25Δ skew, realized vol 1M), HODL waves, stablecoin supply (USDT/USDC), BTC dominance, ETH price (for ETH/BTC ratio) | daily · 08:05 WIB |
| Sentiment + ETF flow ledger | Fear & Greed-style sentiment, US spot BTC ETF per-fund flows, social mindshare, options-derived max-pain and put/call context | daily · 08:05 WIB |
| Technical-structure feed | Multi-timeframe technicals (1h / 4h / 1d / 1w) for BTC / ETH / SOL / HYPE: RSI, MACD, Bollinger, ADX, Stochastic, SMA/EMA, S/R, market structure, sentiment | daily · 08:05 WIB |
| Macro liquidity series | US M2 money supply (M2SL) | daily · 08:20 WIB |
| TradFi market data feed | DXY, SPX, IBIT spot ETF volume (turnover proxy) | daily · 08:20 WIB |
| Signal class | What it powers | Cadence |
|---|---|---|
| US/offshore spot quotes | BTC spot spread → US spot premium index | every 5 min |
| BTC options volatility feed | DVOL, front-month IV, term structure shape, 25Δ skew proxy | every 5 min |
| Derivatives liquidity feed | Liquidation cluster estimates (top-trader long/short × leverage tiers × OI) | every 5 min |
The Execution Layer's Liquidations row estimates nearby long- and short-liquidation clusters from derivatives liquidity, top-trader positioning, and leverage tiers. Treat cluster sizes as estimates; price levels come from the liquidation formula.
Current real-money policy odds are a bounded input to Macro Regime's permission line. They can force a WAIT when zero-cut risk is elevated, but there is no standalone Prediction Markets panel or cross-venue tape.
| Signal class | What it powers | Cadence |
|---|---|---|
| BTC candle feed | BTC daily candles (2 years) for the price chart | on page load |
The dashboard frontend hydrates from /api/cw/snapshot plus a small set of CryptoWatch-owned artifact contracts on every 30-second interval. This reads cached backend data; a browser refresh does not trigger upstream collection.
The sticky banner at the top of the dashboard inspects file mtimes across every signal class and returns a structured freshness map. Each input has an expected cadence (daily / 15min / 5min) and a threshold:
The banner shows the worst status across both groups (daily pipeline + live feeds). Each individual panel ALSO shows a per-panel badge (e.g., 44m · daily or 2m · 5min) so you can see at a glance which panel depends on which cadence. Details accordion (click "details") shows the full per-source breakdown.
Active Value / Investor Value. A Cointime Economics valuation metric that replaces MVRV Z-Score for the post-ETF era by reweighting supply by coin age.
A state of the implied volatility curve where front-month IV is higher than back-month IV. Traders are paying a premium for immediate protection — fear of a near-term move is priced higher than long-term uncertainty. Historically rare and bottom-coincident (2020-03 COVID, 2022-11 FTX both had brief backwardation at the low).
Our composite 0-100% synthesis of bottom-relevant signals: MVRV ratio, NUPL, Puell Multiple, Supply-in-Profit, drawdown depth, LTH MVRV, and Liveliness. Each subscore is weighted by its historical reliability at calling cycle lows. The composite reaches 80-95% at confirmed cycle bottoms (2015, 2018, 2022) and drops to 5-15% at confirmed tops. See §08 Indicator Reference for the component list.
Framework developed by ARK Invest and an on-chain analytics partner (2023) that treats coin-age as the primary dimension for on-chain valuation. Replaces classic MVRV metrics that get distorted by large dormant stashes.
A state of the implied volatility curve where back-month IV is higher than front-month IV. The normal state. Traders are more worried about long-term uncertainty than immediate moves. Steep contango (back-month IV >> front-month) is a distribution warning.
Options terminology for how much an option's price changes per $1 change in the underlying. A 25-delta call moves 25 cents per $1 BTC move. "25Δ skew" compares the IV of 25-delta calls vs 25-delta puts to measure directional positioning without being distorted by at-the-money traders.
The historical observation that recent BTC cycles have shown milder valuation peaks and shallower drawdowns. It is a small-sample structural hypothesis—not a guaranteed curve. The framework tests trailing cycle-relative ranks, legacy thresholds, and post-ETF samples separately. See §05 Framework design rationale and §13 Case studies.
BTC options volatility index. The "crypto VIX" — a 30-day forward-looking implied volatility measurement from BTC options.
Ratio of coindays destroyed to coindays created over the lifetime of the Bitcoin supply. Falling liveliness = LTHs hoarding. Rising liveliness = LTHs distributing.
Long-Term Holder (>155 days) / Short-Term Holder (<155 days). The 155-day threshold comes from on-chain analytics research identifying when coin behavior statistically transitions from reactive to dormant.
Market Value / Realized Value. The ratio of BTC's market cap to its on-chain realized cap (the sum of all UTXOs valued at the price they last moved). MVRV < 1 means the average coin is underwater.
Net Unrealized Profit/Loss. (Market cap − realized cap) / market cap. NUPL < 0 means the network is in net unrealized loss territory — historically rare, only at bear-market bottoms.
The total number of outstanding derivative contracts (futures or options) that have not yet been settled. Each contract has a long and a short side — OI measures the aggregate size of the derivative market. We use BTC futures OI divided by BTC market cap as the leverage regime gauge. See OI / Market Cap.
Daily BTC miner issuance in USD divided by its 365-day moving average. Puell < 0.5 means miner revenue is deeply below its historical norm — historically a bottom signal because it implies capitulation in the miner cohort.
The sum of all BTC valued at the price they last moved on-chain, rather than current market price. If a coin last moved at $30K, it counts as $30K in realized cap — even if BTC is now $75K. Realized cap is the foundation of MVRV, SOPR, LTH/STH cohort metrics, and Realized Price. It's a measure of aggregate cost basis.
Percentage of circulating BTC supply that is currently held at a profit. SIP < 50% means most coins are underwater.
Spent Output Profit Ratio. The average profit ratio of all BTC spent on a given day. SOPR = 1.0 is breakeven. SOPR < 1.0 means the average mover is realizing a loss.
A Cointime Economics variant of Realized Price that reweights supply by dormancy. Unlike raw Realized Price, TMM removes dormant supply from the calculation — so long-lost or deeply-held coins don't drag the mean down. TMM typically sits above Realized Price by 30-80% and acts as a practical support/resistance level on the price chart.
Cointime metric — the fraction of supply that is "vaulted" (aging without being spent). High vaultedness = hoarding regime.
Four indicators (MVRV < 1, NUPL < 0, Puell < 0.5, SIP < 50%) that have only ever all triggered together at the final lows of Bitcoin cycles (2015, 2018, 2022). "Zero false positive" refers to the all-four-simultaneously confluence being historically unique to cycle bottoms. Partial triggers (1–3 of 4) can occur in mid-cycle corrections.
The daily forecast is a deterministic CryptoWatch Core vote over the same live inputs shown on Macro: Composite, Truth, State, and Cycle. It does not run a multi-agent debate, claim analyst agreement, or create discretionary price targets.
  current Macro snapshot + setup evidence
                  |
      deterministic cw_core vote
                  |
        prediction_daily.json
                  |
       server-owned call ledger
                  |
       T+7 / T+30 resolution
                  |
  Forecast Accountability + Track Record
The producer emits direction-only calls for today, week, and month with input provenance and explicit invalidations. Missing or stale source inputs fail the run instead of being converted into invented analyst views or extra calls.
The Forecast Accountability panel is the public record of dated calls and their resolution windows. It separates live forecast accountability from historical backtest performance so the dashboard does not blur real-time calls with hindsight.
Every dated call is stored in the server-owned prediction ledger with its T+0 BTC anchor. The panel reads /api/track-record and reports:
No percentage is shown until its horizon has resolved at least one eligible call. Sample counts remain visible beside every rate; the dashboard does not use browser-local history or seed backfilled wins.
Distribution detection is no longer a standalone “open this panel for X/6” product surface, and the Cycle Top Radar panel itself is now retired. The versioned cycle_top_distribution artifact stays live: persistent distribution phase, honesty-gated horizons, and planned de-risk budget in Action; the top-proximity story is carried by CW Risk. See §12 Cycle Top Radar and the panel field guide.
Family-level evidence still includes valuation extremes (AVIV / MVRV / NUPL / Puell-class), owner distribution (LTH spending, realized profit), demand and ETF flows, leverage/funding crowding, price structure near highs, and cycle timing. Those inputs feed the phase engine; raw indicator count is not conviction.
Older docs counted six classic distribution triggers (AVIV, NUPL, Puell, MA stack, funding, halving regime). That checklist remains educational context only. Product authority is the phase engine plus publication gates — not a hand-counted score that auto-executes exits.
The same L4 positioning indicator can mean different things depending on where the market is in the cycle. Funding at +54% during early markup can be normal bull exuberance; the same reading during distribution danger is a top-risk signal. The scoring engine adjusts thresholds based on the halving regime.
| Regime | -2 (bearish) trigger | -1 trigger | Rationale |
|---|---|---|---|
| Markup / Early Markup | > +80% | > +30% | Bull exuberance is normal — wider triggers avoid false sells |
| Late Markup / Distribution Danger | > +40% | > +10% | Any hot funding is a real top signal — tightened triggers |
| Late Bear / Accumulation | > +80% | > +25% | Negative funding is capitulation (bullish); positive is noise |
| Default (mid/early bear) | > +54% | > +15% | Original static thresholds |
| Regime | High DVOL (>90) score | Rationale |
|---|---|---|
| Late Bear / Mid Bear / Accumulation | +2 (bullish) | Panic = capitulation = bottom signal |
| Late Markup / Distribution Danger | -2 (bearish) | Volatility spike at top = crash starting |
| Markup / Early Markup | +2 (bullish) | Original interpretation — high IV during drawdown is bottom |
| Regime | Overheat trigger | Rationale |
|---|---|---|
| Late Markup / Distribution Danger | 2.0% (tightened from 2.5%) | Leverage at tops is more dangerous — earlier warning |
| Late Bear / Accumulation | 3.5% (loosened from 2.5%) | Elevated OI in a bear is less alarming |
| Default | 2.5% | Original static threshold |
When the 30-day BTC-SPX correlation is > 0.6 (risk-asset regime), L1 Macro scores are multiplied by 1.5x and L3 On-Chain by 0.75x. When correlation is < 0.3 (decoupled), the reverse applies. This mechanizes the insight that macro dominates when BTC trades like a risk asset, and on-chain dominates when BTC decouples.
Next to the composite score, a small badge shows the 7-day and 30-day change in the composite score. This answers: "Is the framework accelerating toward a bottom or stalling?"
The velocity is stored in your browser's localStorage (rolling 30-day window). It accumulates one data point per daily visit. After 7 days you'll see the 7d delta; after 30 days both deltas appear.
| Display | Meaning |
|---|---|
| ▲+3 / 7d | Composite moving toward stronger buy — bottom signals strengthening |
| ▼-2 / 7d | Composite weakening — buy conviction fading or sell signals emerging |
| ▬+0 / 7d | No change — market in stasis |
The 30d delta is the more interesting one for macro cycle analysis — it shows whether the framework has been structurally improving or deteriorating over a full month.
Real questions, mapped to the exact current surfaces and readings that answer them. Grouped by who's asking.
Surfaces: Composite (Now primary) → read the verdict (BUY / WAIT / SELL) and score. Open Decision Integrity (Supporting signals) for coverage and agreement. If confidence < 60%, data is stale or indicators disagree — wait for clarity.
Cross-check: Cycle Position Bottoming receipt (low X/6 = no confirmation yet), Cycle Position phase bar, Fear & Greed-style sentiment as context if on-chain scoring agrees.
Surfaces: Macro Permission → Tail-Risk receipt. BTC Setup → DCA map receipt (zones from live Realized Price). Cycle Position → Cointime receipt for AVIV / liveliness.
Read: Treat the active tail scenarios as invalidation conditions, then size only at the realized-price zones. CryptoWatch no longer publishes an unowned probability tree or point-target simulator.
Panel: DCA Map — receipt on BTC Setup. Zones are a research-only planning ladder from live Realized Price. They do not represent observed execution. Open the sibling “where valuation waits” receipt on BTC Setup for the zone ladder.
Surface: Cycle Position → Bottoming process receipt → current bottoming state, confirmation score X/6 (each gate PASS or OPEN), and invalidation watch (ACTIVE / CLEAR).
Also check: descriptive proximity on the same receipt; the sibling historical-validation receipt; Cycle Position phase bar and CW Risk (Supporting signals) for orientation; do not wait for a published likelihood % until its calibration receipt says so.
Panel: CW Risk carries the top-proximity read — the retired Cycle Top Radar's artifact still publishes distribution phase first (EARLY / ACTIVE / EXHAUSTION). Horizon percentages stay unavailable until calibration gates pass.
Also check: planned 20/50/30 de-risk budget eligibility in Action; Money (Liquidity + Entity Regime); Action timing rows on BTC Setup. Market Pulse Scorecard is retired — use Macro Permission.
Surface: Cycle Position → LTH cohort receipt for net position change, SOPR, and MVRV. Entity Regime → LTH→exchange receipt for coins moving to exchanges.
Cross-check: Entity Regime plus Liquidity ETF receipts. When LTH and ETF agree, conviction is highest.
Surface: Macro Permission → M2, dollar, rates, and risk receipts. Look for permission vs headwind, not a second Now verdict.
Cross-check: prediction-market pricing for Fed rate probability and policy regime.
Surfaces: Cycle Position value-zone receipt (aggregate MVRV + position in zone). Cycle Position LTH cohort receipt (LTH MVRV separately). STH MVRV remains a confirming scoring input, not a standalone panel. Composite scoring still uses each MVRV variant in L3.
Rule: Signal Conflict Resolver → Rule 2: "MVRV Aggregate > LTH SOPR for cycle reads." STH MVRV below 1.0 is a leading indicator of cohort stress but doesn't override aggregate valuation.
Surfaces: Cycle Position → Cointime receipt for CDD / AVIV. Entity Regime and Liquidity ETF receipts → the owned LTH/ETF bull/bear evidence.
Rule: The Composite conflict resolver gives owned cohort alignment authority over CDD for structural calls. CDD measures old-coin movement — it fires for tax-loss harvesting, custody rebalancing, and real selling. When LTH + ETF both point bull, CDD is probably flagging movement, not surrender.
Surface: BTC Setup → Timing rows receipt (Funding, Options, Liquidations, Contrarian). Funding is execution-timing evidence for the existing Action thesis, not a standalone carry-trade panel.
Cross-check: the Options row’s IV term structure for whether funding is expected to normalize (contango) or persist (backwardation).
Surfaces: Cycle Position → phase bar (default). Bottoming receipt and CW Risk (Supporting signals) at the extremes. Cowen suite is a Cycle Position receipt.
Cross-check: halving-day context inside Cycle Position; never treat calendar day-count alone as a top or bottom call. Terminal-top day probabilities publish only when gates pass.
Surfaces: Liquidity (ETF / pipeline receipt, plus the sibling 24h · 30d · context receipt). Entity Regime for who is driving, including the LTH→exchange receipt.
Read: Steady net inflows with muted activity can still be accumulation; the Bottoming process ETF dual-gate requires both stabilization and non-muted activity before that confirmation gate PASSes. Market Pulse Scorecard is retired.
Surface: Macro Permission → risk / correlation receipts. BTC-SPX 30d correlation still feeds the composite scoring engine as a layer multiplier. There is no standalone Macro-Beta Mode panel.
Rule: Correlation > 0.6 → L1 Macro scores weighted 1.5x, L3 On-Chain 0.75x. Correlation < 0.3 → reverse. Shown in the composite breakdown table with multiplier annotations.
Surface: Track Record / Ledger — resolved directional calls and calibration. Historical cycle-inflection grades remain methodology context on this page, not a live Historical Backtest panel.
Also: four-layer agreement vs conflict on Decision Integrity. Low cross-layer correlation means each layer adds independent information; high correlation means you are reading one signal four times.
Surfaces: Macro Permission → Tail-Risk receipt. BTC Setup → DCA map receipt. Composite / Decision Integrity → coverage vs agreement.
Rule: Four-layer agreement raises conviction; L4 conflict keeps timing unconfirmed; hostile L1 lowers confidence in bullish posture. Position sizing remains outside the framework.
Surface: CryptoWatch is BTC-first. There is no standalone Cross-Asset Bottom Signals panel. Use Cycle Position (phase + bottoming) plus Macro Permission (cross-asset risk) for Bitcoin; do not treat alt drawdown tables as a current product surface.
Also: Liquidity pipeline receipts show whether capital is entering Bitcoin. Rotation into alts is not a live Macro owner.
Surfaces: Action (BTC Setup) for planned de-risk budget eligibility. CW Risk (Cycle supporting) for distribution-phase / top-proximity. Composite’s Now canvas for the Bitcoin Thermometer 0–100 heat. There is no standalone Distribution Playbook or Distribution Confluence panel.
Also: time window, realized-price multiples, and on-chain heat remain methodology context — not a second Action owner.
The supported machine surface is intentionally smaller than the internal runtime. The OpenAPI document is the stability contract; browser helpers and compatibility routes are not automatically public promises.
Strategy treasury mNAV is no longer a user-facing Macro panel. Its fail-closed data capability remains intentionally available through /api/public/v1/mstr/mnav and MCP tool cw.mstr_mnav, and the same holdings configuration remains an input to the Tail-Risk Register. Removing the panel does not retire those API, MCP, or risk-monitoring contracts.
Read endpoints allow anonymous access at the lower limit. To create a developer key for higher limits and write operations, sign in to your CryptoWatch account and use Account → Developer keys; the key is returned once and is owned by that account. Keep it outside browser storage, chat messages, and source control. To have a coding agent wire the REST API into a project, use Account → Developer credentials → Copy prompt and keep the raw key in CW_API_KEY.
curl -X POST https://cryptowatch.id/api/public/v1/webhooks \
  -H "X-API-Key: $CRYPTOWATCH_API_KEY" \
  -H 'Content-Type: application/json' \
-d '{"url":"https://example.com/cw","events":["composite.changed"]}'The separately graded research-thesis engine is visible on Track Record. Its current theses and calibration remain experimental research endpoints, not part of the stable public API contract and not the official deterministic Daily Bitcoin Call.
cryptowatch.id is a research and synthesis tool. It presents publicly available on-chain, macro, and derivatives data in a single interface with transparent scoring math. It is not a signal service, it is not investment advice, it does not know your risk tolerance or capital, and it cannot see the future.
Cycle frameworks fail. Past patterns do not repeat mechanically. The same data can be correct at one cycle turn and wrong at the next. Use this tool as one input among many. Never size a position based on a dashboard verdict alone.
The public methodology documents the scoring logic and the sources that can be disclosed. Some inputs depend on licensed or private upstream access, and the public API is intentionally a supported subset rather than an exhaustive mirror of every internal artifact.
Hong Kong spot BTC ETF daily flows track institutional demand from Asia via three HK-listed funds: ChinaAMC, Harvest, and Bosera & HashKey. These are the only spot BTC ETFs accessible to mainland Chinese investors through the Stock Connect program.
Net positive flow indicates creations (new BTC entering custody) — a bullish signal for Asia-led demand. Net negative flow indicates redemptions — distribution pressure. When HK flows are strongly positive while US flows are neutral or negative, it signals a demand rotation toward Asia. Persistent outflows suggest mainland appetite is cooling.
Data source: CryptoWatch-derived derivatives artifact. Updated daily.
Public and private company BTC treasury holdings tracked through CryptoWatch's treasury artifact. Covers listed companies, miners, ETFs, governments, and private firms with material BTC on their balance sheet.
The total BTC held by all tracked entities is a structural supply-absorption metric. When public companies accumulate, it removes float from circulation. When they distribute, it adds supply pressure. Watch the top holders list for concentration risk — if one entity controls more than 5% of circulating supply, their liquidation risk becomes a macro factor. Miner holdings are particularly sensitive to hash-price regime shifts.
Data source: CryptoWatch-derived treasury artifact. Updated daily.
A unified verdict from ~30 signal feeds. Most dashboards show each signal in isolation. The Truth Engine ingests all of them, normalizes to a single −3..+3 scale, detects where feeds disagree, applies domain-weighted resolution rules, and tells you: what's the consensus, where do feeds conflict, and what's the strongest counter-case?
Four primitives unified: (1) owned cohort alignment — LTH/ETF agreement; (2) Trap Divergence — price-vs-signals divergence flags; (3) domain-weighted signal voting — source conflicts resolved by declared authority; (4) Composite Gauge — 4-layer weighted vote.
Conflict types detected: pairwise — two individual sources disagree; cross-layer — Macro says one thing, On-Chain says another; temporal — short-term (funding/sentiment) vs long-term (halving/Tier 1). Each conflict reduces overall confidence by 5-15% depending on severity.
Authority override: Tier 1 on-chain sources (Puell, MVRV, NUPL, Supply-in-Profit) with |score| = 3 can override up to 2 dissenting lower-tier sources. This prevents a single noisy sentiment reading from swamping a clear structural signal.
Steelman: Every verdict carries a mandatory counter-case — the strongest evidence-based argument against the consensus. A Truth Engine without an adversarial counter-case is just an average.
Signal feeds: all inputs already in the Macro snapshot (~30 feeds across L1 Macro, L2 Cycle, L3 On-Chain, and L4 Positioning & Timing). No new API calls. Backend-computed, 60s cache.
Standard cycle indicators tell you WHERE you are in the cycle. Entity Regime tells you WHO is driving it — which changes everything about what the signal means.
In the ETF era, "LTH supply dropping" can mean either: (a) bearish — old whales distributing into exchange demand, or (b) bullish — coins being absorbed by structural ETF bid. The current classifier uses owned on-chain, ETF-flow, spot-premium, and cycle caches; missing inputs are surfaced as input coverage rather than quietly treated as neutral.
Active regime types: Retail Distribution (LTH → exchanges → demand, classic top risk); Miner Capitulation (forced selling below breakeven, bottom signal); Miner OTC Absorption (miner sell pressure without exchange confirmation); Double Exit (LTH + miners both distributing, strongest bear); Structural Bid (ETF inflows + LTH holding, strongest bull); Stablecoin Buildup (dry powder accumulating); Regime Confusion (signals contradict, wait for clarity). Retired third-party label modes stay retired unless a real owned replacement exists.
How to use it: trade with the regime only when the driver, evidence chips, and cross-source check line up. When the panel says Regime Confusion, it is telling you not to force a narrative; the highest-EV move is waiting for the supply cohorts to agree.
Zero new API credits. Reads existing on-chain metric parquets (LTH supply, miner outflow, exchange balances), ETF-flow history, spot-premium context, and stablecoin context. No additional private-source calls. Heuristic-first decision tree; historical tracking lives in the entity-regime accuracy table.